Statistics for Business
Consider the following set of test scores: 68,72,65,70,69,74,70,71,67,73,80,72,70,75,7768,72,65,70,69,74,70,71,67,73,80,72,70,75,77. Identify the outliers, if any.
Given the data set 1212, 1515, 1010, 1818, 1414, 2020, 1313, 1717, 1111, and 1616, find the midquartile.
A scientist measures the temperature of a chemical reaction and finds it is at the third quartile for all recorded reactions. What does this indicate about the temperature compared to the other reactions?
For a symmetric bell-shaped distribution, which pair correctly names the measure of center and the measure of dispersion used together to describe the distribution?
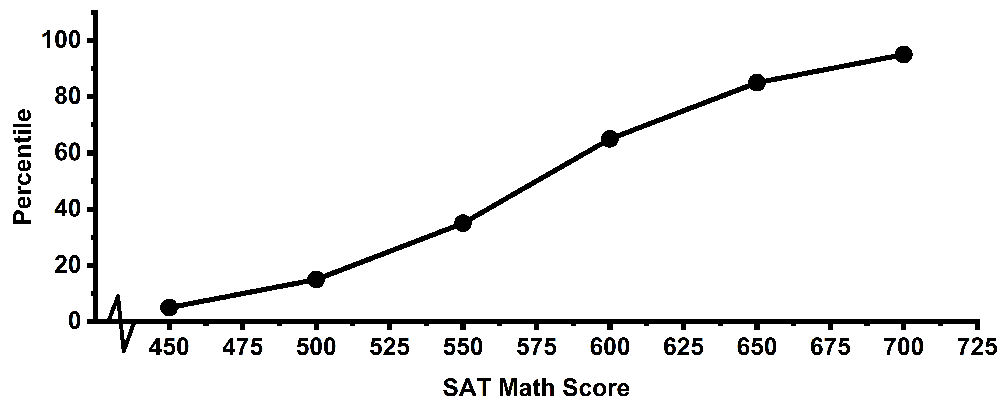
The ogive shown below displays the percentiles of math scores for a sample of students. Which score marks the 5050th percentile according to the ogive? What does this percentile indicate?
An online retailer tracks how long customers spend in live chat (in minutes) to resolve an issue. For a recent month, the summary for a sample of chats is: Q1=18Q_1=18, Q2=24Q_2=24, Q3=35Q_3=35. Determine the interquartile range (IQRIQR).
A pediatric growth chart reports that an 88-year-old girl's weight of 56.256.2 pounds is at the 40th40^{th} percentile. Which statement best interprets this percentile?
The measure defined by Q3−Q1Q_3-Q_1 is best described as which of the following?
The following data set lists the number of hours spent studying by a group of college students for a final exam: 1212, 88, 1515, 1010, 1414, 99, 1111, 1313, 77, 1010, 1212, 88, 1414, 77, 1313, 1010, 1212, 99, 1111, 1313. What is the 5050th percentile value for hours studied? How would you interpret this result?
Determine whether the statement is true or false.
The first quartile represents the value below which 50%50\% of the data fall.