Skip to main content
Statistics for Business
나의 코스
배우기
시험 준비
AI 튜터
학습 가이드
플래시카드
탐험해 보세요
앱을 사용해 보세요
나의 코스
배우기
시험 준비
AI 튜터
학습 가이드
플래시카드
탐험해 보세요
앱을 사용해 보세요
뒤로
Dot Plots quiz
카드를 뒤집기 위해 탭할 수 있습니다.
What type of data are dot plots best suited for displaying?
카드를 뒤집기 위해 탭할 수 있습니다.
👆
What type of data are dot plots best suited for displaying?
Dot plots are best for displaying quantitative or numerical data.
진행 상황 추적
컨트롤 버튼이 '내비게이션' 모드로 변경되었습니다.
1/15
관련 플래시카드
관련 실천
추천 영상
Dot Plots definitions
Dot Plots
15 용어
Dot Plots
2. Describing Data with Tables and Graphs
10 문제점
주제
Ally
Stemplots (Stem-and-Leaf Plots)
2. Describing Data with Tables and Graphs
10 문제점
주제
David-Paige
2. Describing Data with Tables and Graphs
10 주제
15 문제점
장
David-Paige
VideoThumbView.guidedCourse
04:01
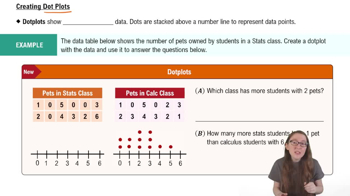
Creating Dotplots
299
views
4
rank
이 집합의 용어 (15)
하이드의 정의
What type of data are dot plots best suited for displaying?
Dot plots are best for displaying quantitative or numerical data.
What is the first step in creating a dot plot?
The first step is to draw a number line representing the range of your data.
How do you represent repeated values in a dot plot?
You stack dots above the corresponding value on the number line for each repeated value.
What does each dot in a dot plot represent?
Each dot represents one data point from the dataset.
How can dot plots help in comparing data points between groups?
Dot plots allow you to visually compare the number of dots above specific values for different groups.
What should you do after adding a dot for a data point when creating a dot plot?
You should cross off the data point to avoid counting it more than once.
How do you determine the number of students with a specific value (e.g., pets) using a dot plot?
Count the number of dots above the value on the number line to find the number of students.
If there are three dots above the number two in a dot plot, what does that indicate?
It indicates that three students (or data points) have the value two.
How can you use dot plots to answer questions about differences between groups?
You compare the number of dots above relevant values in each group's dot plot and subtract if needed.
What advantage do dot plots have over histograms?
Dot plots show the specific values in the dataset, not just the frequency in intervals.
What does it mean if there are no dots above a value in a dot plot?
It means that no data points in the dataset have that value.
How do you find out which group has more data points for a specific value using dot plots?
Compare the number of dots above that value in each group's dot plot.
What is the purpose of stacking dots in a dot plot?
Stacking dots visually represents the frequency of repeated values.
How can dot plots help identify trends in data?
Dot plots make it easy to spot clusters, gaps, and outliers in the data.
Why is it important to cross off data points as you add them to a dot plot?
Crossing off prevents accidentally adding extra dots for the same data point.
 뒤로뒤로
뒤로뒤로

 04:01
04:01