Skip to main content
Statistics for Business
나의 코스
배우기
시험 준비
AI 튜터
학습 가이드
플래시카드
탐험해 보세요
앱을 사용해 보세요
나의 코스
배우기
시험 준비
AI 튜터
학습 가이드
플래시카드
탐험해 보세요
앱을 사용해 보세요
뒤로
Finding Probabilities and T Critical Values - Excel quiz
카드를 뒤집기 위해 탭할 수 있습니다.
Which Excel function is used to find t critical values for a confidence interval with a two-tail probability?
카드를 뒤집기 위해 탭할 수 있습니다.
👆
Which Excel function is used to find t critical values for a confidence interval with a two-tail probability?
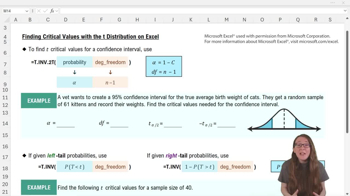
The function is t.inv.2t, which requires the combined tail probability (alpha) and degrees of freedom as inputs.
진행 상황 추적
컨트롤 버튼이 '내비게이션' 모드로 변경되었습니다.
1/15
관련 플래시카드
관련 실천
추천 영상
Finding Probabilities and T Critical Values - Excel definitions
Finding Probabilities and T Critical Values - Excel
15 용어
7. Sampling Distributions & Confidence Intervals: Mean - Part 1 of 2
3 주제
15 문제점
장
Ally
7. Sampling Distributions & Confidence Intervals: Mean - Part 2 of 2
1 주제
2 문제점
장
Zachary
VideoThumbView.guidedCourse
07:54
Finding Probabilities From t-Scores
87
views
1
rank
VideoThumbView.guidedCourse
08:35
Finding t Critical Values From Probabilities - Excel
157
views
1
rank
VideoThumbView.guidedCourse
04:12
Finding Probabilities From t-Scores Example 1
71
views
이 집합의 용어 (15)
하이드의 정의
Which Excel function is used to find t critical values for a confidence interval with a two-tail probability?
The function is t.inv.2t, which requires the combined tail probability (alpha) and degrees of freedom as inputs.
How do you calculate degrees of freedom for the t-distribution in Excel?
Degrees of freedom are calculated as the sample size n minus 1 (n-1).
What is the formula for alpha when constructing a confidence interval?
Alpha is calculated as 1 minus the confidence level (alpha = 1 - confidence level).
How do you obtain the negative t critical value in Excel after finding the positive value?
You can either manually add a negative sign or use Excel to multiply the positive value by -1.
Which Excel function is used to find a t score for a left-tail probability?
The function is t.inv, which takes the left-tail probability and degrees of freedom as inputs.
How do you convert a right-tail probability to a left-tail probability for use in t.inv?
Use the complement rule: left-tail probability = 1 - right-tail probability.
What Excel function is used to find the probability of getting a t score below a certain value?
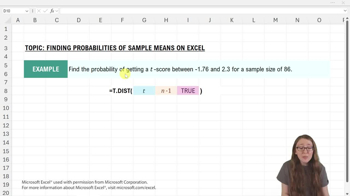
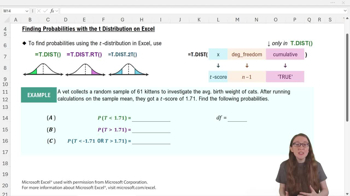
Use t.dist with the t score, degrees of freedom, and cumulative set to TRUE.
What are the three inputs required for the t.dist function in Excel?
The inputs are the t score, degrees of freedom, and cumulative (always TRUE for left-tail probability).
Which Excel function is used to find the probability of getting a t score above a certain value?
Use t.dist.rt, which requires the t score and degrees of freedom as inputs.
What is the difference in inputs between t.dist and t.dist.rt functions?
t.dist requires three inputs (t score, degrees of freedom, cumulative), while t.dist.rt only requires two (t score and degrees of freedom).
Which Excel function is used to find a two-tail probability for the t-distribution?
Use t.dist.2t, which takes the positive t score and degrees of freedom as inputs.
When using t.dist.2t, which t score should you input if you have both a negative and positive value?
Always input the positive t score; entering the negative value will result in an error.
What does the cumulative argument in t.dist indicate?
Cumulative set to TRUE tells Excel to calculate the cumulative left-tail probability.
What happens if you try to use the cumulative argument in t.dist.rt or t.dist.2t?
You will get an error because these functions only accept two inputs: t score and degrees of freedom.
Why is using Excel advantageous for finding t critical values compared to using tables?
Excel allows you to find critical values for any confidence level and sample size, which is not possible with static tables.
 뒤로뒤로
뒤로뒤로

 07:54
07:54