Skip to main content
Statistics for Business
나의 코스
배우기
시험 준비
AI 튜터
학습 가이드
플래시카드
탐험해 보세요
앱을 사용해 보세요
나의 코스
배우기
시험 준비
AI 튜터
학습 가이드
플래시카드
탐험해 보세요
앱을 사용해 보세요
뒤로
Goodness of FIt Test Using TI-84 quiz
카드를 뒤집기 위해 탭할 수 있습니다.
What is the purpose of a chi-square goodness of fit test?
카드를 뒤집기 위해 탭할 수 있습니다.
👆
What is the purpose of a chi-square goodness of fit test?
It is used to compare observed frequencies to expected values to determine if the observed data fits a claimed distribution.
진행 상황 추적
컨트롤 버튼이 '내비게이션' 모드로 변경되었습니다.
1/15
관련 플래시카드
관련 실천
추천 영상
Goodness of FIt Test Using TI-84 definitions
Goodness of FIt Test Using TI-84
15 용어
13. Chi-Square Tests & Goodness of Fit - Part 1 of 2
3 주제
17 문제점
장
Brendan
13. Chi-Square Tests & Goodness of Fit - Part 2 of 2
1 주제
3 문제점
장
David-Paige
VideoThumbView.guidedCourse
04:49
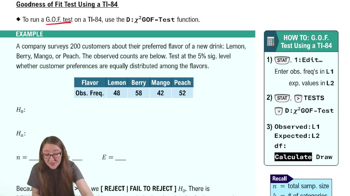
Goodness of Fit Test Using a TI-84
126
views
VideoThumbView.guidedCourse
03:25
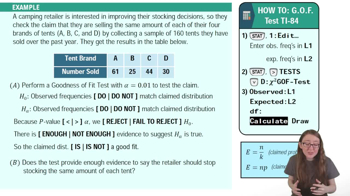
Goodness of Fit Test Using a TI-84 Example 3
93
views
VideoThumbView.guidedCourse
03:46
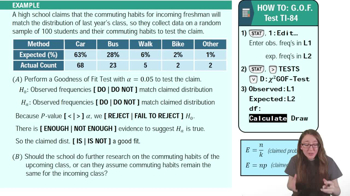
Goodness of Fit Test Using a TI-84 Example 1
90
views
이 집합의 용어 (15)
하이드의 정의
What is the purpose of a chi-square goodness of fit test?
It is used to compare observed frequencies to expected values to determine if the observed data fits a claimed distribution.
How do you state the null hypothesis in a goodness of fit test?
The null hypothesis states that the observed frequencies match the claim distribution.
What is the alternative hypothesis in a goodness of fit test?
The alternative hypothesis states that the observed frequencies do not match the claim distribution.
How do you calculate expected values when the claim is equal distribution among categories?
Use the formula e = n / k, where n is the total sample size and k is the number of categories.
If 200 people are surveyed about 4 flavors, what is the expected value for each flavor?
The expected value for each flavor is 200 divided by 4, which equals 50.
How do you determine the degrees of freedom for a goodness of fit test?
Degrees of freedom are calculated as k - 1, where k is the number of categories.
What are the steps to enter observed and expected data into a TI-84 for a GOF test?
Enter observed frequencies in L1 and expected values in L2 using the STAT button.
Which menu option on the TI-84 is used for the chi-square goodness of fit test?
Use option D, the chi-square GOF test, in the TESTS menu.
What must you check regarding degrees of freedom when using the TI-84 for a GOF test?
Ensure the degrees of freedom in the calculator matches your problem, adjusting it if necessary.
What key result do you compare to the significance level in a GOF test?
You compare the p-value to the alpha (significance) level.
What does it mean if the p-value is greater than the significance level?
It means you fail to reject the null hypothesis, indicating insufficient evidence to say the observed frequencies differ from the claim.
What does the 'CNTRB' value shown in the TI-84 output represent?
It shows each observed frequency's contribution to the overall chi-square statistic.
If the p-value is 0.44 and alpha is 0.05, what is your conclusion?
Since 0.44 > 0.05, you fail to reject the null hypothesis and conclude the observed data fits the claim distribution.
Why is it important to use the chi-square GOF test (option D) and not just the chi-square test on the TI-84?
Because the GOF test is specifically designed for comparing observed and expected frequencies across categories.
What is the main conclusion if you fail to reject the null hypothesis in a goodness of fit test?
You conclude that the observed data is consistent with the expected distribution based on the claim.
 뒤로뒤로
뒤로뒤로

 04:49
04:49