Skip to main content
Statistics for Business
나의 코스
배우기
시험 준비
AI 튜터
학습 가이드
플래시카드
탐험해 보세요
앱을 사용해 보세요
나의 코스
배우기
시험 준비
AI 튜터
학습 가이드
플래시카드
탐험해 보세요
앱을 사용해 보세요
뒤로
Mean quiz
카드를 뒤집기 위해 탭할 수 있습니다.
How do you calculate the mean of a dataset?
카드를 뒤집기 위해 탭할 수 있습니다.
👆
How do you calculate the mean of a dataset?
Add all the values together and divide by the total number of values.
진행 상황 추적
컨트롤 버튼이 '내비게이션' 모드로 변경되었습니다.
1/15
관련 플래시카드
관련 실천
추천 영상
Mean definitions
Mean
14 용어
Mean
3. Describing Data Numerically
10 문제점
주제
Brendan
Median
3. Describing Data Numerically
10 문제점
주제
Jonathan
3. Describing Data Numerically
8 주제
19 문제점
장
Jonathan
VideoThumbView.guidedCourse
03:08
Calculating the Mean Example 1
453
views
21
rank
VideoThumbView.guidedCourse
04:52
Calculating the Mean
662
views
13
rank
이 집합의 용어 (15)
하이드의 정의
How do you calculate the mean of a dataset?
Add all the values together and divide by the total number of values.
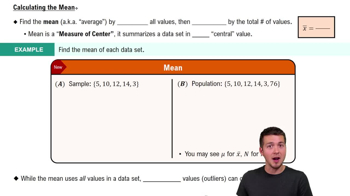
What is the mean of the dataset {5, 10, 12, 14, 3}?
The mean is 8.8, calculated as (5+10+12+14+3)/5.
What symbol is commonly used to represent the sample mean?
The sample mean is represented by x̄ (x bar).
What does the Greek letter sigma (Σ) indicate in the mean formula?
Sigma (Σ) means to sum all the values in the dataset.
What does 'n' represent in the mean formula?
'n' represents the total number of values in the dataset.
What is the formula for the sample mean?
The formula is x̄ = Σx / n.
What is the formula for the population mean?
The formula is μ = Σx / N, where μ is the population mean and N is the population size.
How does adding an outlier affect the mean?
Adding an outlier can significantly shift the mean, making it less representative of the central tendency.
What is the mean of the dataset {5, 10, 12, 14, 3, 76}?
The mean is 20, calculated as (5+10+12+14+3+76)/6.
What is a measure of central tendency?
A measure of central tendency summarizes a dataset with a single central value.
What is the difference between x̄ and μ?
x̄ is used for sample mean, while μ is used for population mean.
Does the method for calculating mean change between a sample and a population?
No, you always add all values and divide by the total number, but notation changes.
What happens to the mean when you add a value much larger than the others?
The mean increases and may no longer accurately reflect the center of the original data.
Why should you be careful with outliers when interpreting the mean?
Outliers can distort the mean, making it less representative of most data values.
If you are unsure which mean notation to use, which is safest?
x̄ (x bar) is usually the safest bet for representing the mean.
 뒤로뒤로
뒤로뒤로

 03:08
03:08