Statistics for Business
나의 코스
배우기
시험 준비
AI 튜터
학습 가이드
플래시카드
탐험해 보세요
앱을 사용해 보세요
나의 코스
배우기
시험 준비
AI 튜터
학습 가이드
플래시카드
탐험해 보세요
앱을 사용해 보세요
뒤로
Non-Standard Normal Distribution definitions
카드를 뒤집기 위해 탭할 수 있습니다.
Standard Normal Distribution
카드를 뒤집기 위해 탭할 수 있습니다.
👆
Standard Normal Distribution
A bell-shaped curve with a mean of zero and a standard deviation of one, used as a reference for probability calculations.
진행 상황 추적
컨트롤 버튼이 '내비게이션' 모드로 변경되었습니다.
1/15
관련 플래시카드
관련 실천
추천 영상
Non-Standard Normal Distribution quiz
Non-Standard Normal Distribution
15 용어
Non-Standard Normal Distribution
6. Normal Distribution & Continuous Random Variables
10 문제점
주제
Ernest
6. Normal Distribution & Continuous Random Variables
4 주제
15 문제점
장
Ernest
04:05
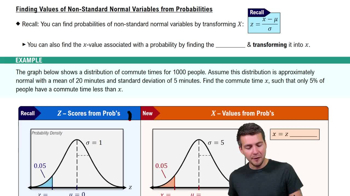
Finding Values of Non-Standard Normal Variables from Probabilities
209
views
4
rank
06:05
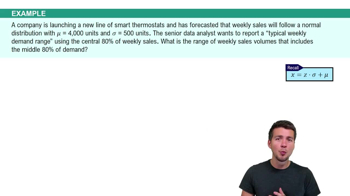
Finding Values of Non-Standard Normal Variables from Probabilities Example 2
160
views
3
rank
09:02
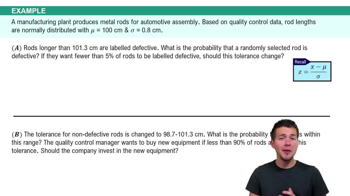
Finding Z-Scores for Non-Standard Normal Variables Example 1
211
views
5
rank
이 집합의 용어 (15)
하이드의 정의
Standard Normal Distribution
A bell-shaped curve with a mean of zero and a standard deviation of one, used as a reference for probability calculations.
Nonstandard Normal Distribution
A bell-shaped curve with any mean and standard deviation, requiring transformation for standard analysis.
Mean
The central value around which data points are distributed, often denoted by the Greek letter mu.
Standard Deviation
A measure of spread indicating how much data points deviate from the mean, symbolized by sigma.
Z-Score
A value representing how many standard deviations a data point is from the mean, enabling comparison across distributions.
Probability
The likelihood or area under the curve to the left of a specific value in a normal distribution.
Z Table
A reference chart or tool used to find probabilities associated with specific z-scores in a standard normal distribution.
Transformation Equation
The formula (x - mu) divided by sigma, used to convert a value from a nonstandard to a standard normal distribution.
Bell Curve
A graphical representation of a normal distribution, symmetric and centered around the mean.
Area
The portion under the normal curve corresponding to the probability of a value or range of values.
Commute Time
An example variable representing the time taken for travel, used to illustrate normal distribution concepts.
X Value
A specific data point in a distribution, often found by reversing the z-score transformation.
Left Tail
The portion of the normal curve representing values less than a specified point, often used in probability calculations.
Sampling Data
A collection of observed values from a population, used to illustrate distribution properties.
Calculator
A tool used to compute probabilities, z-scores, or x values when working with normal distributions.