Skip to main content
Statistics for Business
나의 코스
배우기
시험 준비
AI 튜터
학습 가이드
플래시카드
탐험해 보세요
앱을 사용해 보세요
나의 코스
배우기
시험 준비
AI 튜터
학습 가이드
플래시카드
탐험해 보세요
앱을 사용해 보세요
뒤로
Probabilities & Z-Scores w/ Graphing Calculator definitions
카드를 뒤집기 위해 탭할 수 있습니다.
Z-Score
카드를 뒤집기 위해 탭할 수 있습니다.
👆
Z-Score
A standardized value indicating how many standard deviations a data point is from the mean in a normal distribution.
진행 상황 추적
컨트롤 버튼이 '내비게이션' 모드로 변경되었습니다.
1/15
관련 플래시카드
관련 실천
추천 영상
Probabilities & Z-Scores w/ Graphing Calculator quiz
Probabilities & Z-Scores w/ Graphing Calculator
15 용어
Probabilities & Z-Scores w/ Graphing Calculator
6. Normal Distribution & Continuous Random Variables
10 문제점
주제
Jonathan
Non-Standard Normal Distribution
6. Normal Distribution & Continuous Random Variables
10 문제점
주제
Ernest
6. Normal Distribution & Continuous Random Variables
4 주제
15 문제점
장
Ernest
06:31
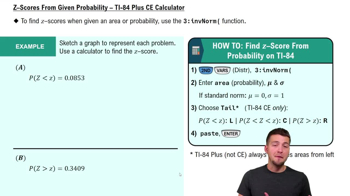
Z-Scores From Given Probability - TI-84 (CE) Calculator
230
views
2
rank
07:09
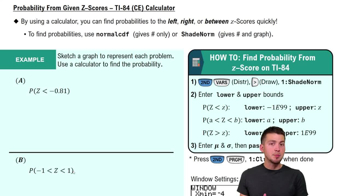
Probability From Given Z-Scores - TI-84 (CE) Calculator
372
views
5
rank
이 집합의 용어 (15)
하이드의 정의
Z-Score
A standardized value indicating how many standard deviations a data point is from the mean in a normal distribution.
Normal Distribution
A symmetric, bell-shaped curve where most values cluster around the mean, with probabilities determined by area under the curve.
TI-84 Calculator
A graphing calculator model commonly used for statistical calculations, featuring built-in probability and distribution functions.
Normalcdf Function
A calculator tool that computes the probability or area under the normal curve between specified bounds.
Inverse Norm Function
A calculator feature that finds the z-score corresponding to a given cumulative probability in a normal distribution.
Standard Normal Distribution
A normal distribution with a mean of zero and a standard deviation of one, used as a reference for z-scores.
Lower Bound
The leftmost value specified when calculating area under the curve, often set to a very large negative number for left-tail probabilities.
Upper Bound
The rightmost value specified when calculating area under the curve, marking the endpoint for probability calculations.
Area
The region under the normal curve between two points, representing the probability of a value falling within that range.
Left-Tail Probability
The probability that a value is less than a specified point, represented by the area to the left of that point under the curve.
Right-Tail Probability
The probability that a value exceeds a specified point, represented by the area to the right of that point under the curve.
Mean
The central value of a distribution, serving as the reference point for z-scores in a normal curve.
Standard Deviation
A measure of spread in a distribution, indicating the average distance of data points from the mean.
Distribution Menu
A calculator interface section where statistical functions like normalcdf and inverse norm are accessed.
Graphing Window Settings
Calculator parameters that control the visible range of the graph, ensuring the normal curve and shaded areas are displayed correctly.
 뒤로뒤로
뒤로뒤로

 06:31
06:31