Skip to main content
Statistics for Business
나의 코스
배우기
시험 준비
AI 튜터
학습 가이드
플래시카드
탐험해 보세요
앱을 사용해 보세요
나의 코스
배우기
시험 준비
AI 튜터
학습 가이드
플래시카드
탐험해 보세요
앱을 사용해 보세요
뒤로
Two Proportions Hypothesis Test - Excel definitions
카드를 뒤집기 위해 탭할 수 있습니다.
Null Hypothesis
카드를 뒤집기 위해 탭할 수 있습니다.
👆
Null Hypothesis
Assumes no difference exists between two population proportions; serves as the default claim in hypothesis testing.
진행 상황 추적
컨트롤 버튼이 '내비게이션' 모드로 변경되었습니다.
1/15
관련 플래시카드
관련 실천
추천 영상
Two Proportions Hypothesis Test - Excel quiz
Two Proportions Hypothesis Test - Excel
15 용어
Two Means - Unknown, Unequal Variance
10. Hypothesis Testing for Two Samples
10 문제점
주제
Ally
10. Hypothesis Testing for Two Samples - Part 1 of 2
3 주제
15 문제점
장
Ally
10. Hypothesis Testing for Two Samples - Part 2 of 2
3 주제
8 문제점
장
Justin
VideoThumbView.guidedCourse
09:31
Two Proportions Hypothesis Test - Excel
102
views
1
rank
VideoThumbView.guidedCourse
08:25
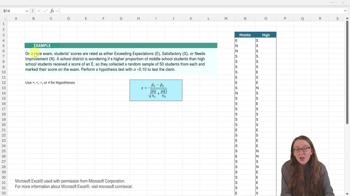
Two Proportions Hypothesis Test - Excel Example 1
77
views
1
rank
VideoThumbView.guidedCourse
10:28
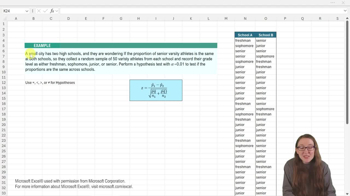
Two Proportions Hypothesis Test - Excel Example 2
84
views
1
rank
이 집합의 용어 (15)
하이드의 정의
Null Hypothesis
Assumes no difference exists between two population proportions; serves as the default claim in hypothesis testing.
Alternative Hypothesis
Represents the claim being tested, suggesting a difference or specific relationship between two population proportions.
Sample Proportion
Calculated by dividing the number of successes in a sample by the sample size, representing observed probability.
Pooled Proportion
Combines successes and sample sizes from both groups to estimate a common probability for hypothesis testing.
Z Score
Quantifies how many standard errors the observed difference in sample proportions is from the hypothesized difference.
P Value
Probability of observing a test statistic as extreme as, or more extreme than, the one calculated, assuming the null is true.
Significance Level
Threshold probability, often set at 0.05, used to decide whether to reject the null hypothesis.
Sampling Distribution
Describes the probability distribution of a statistic, such as the difference in sample proportions, over repeated samples.
Test Statistic
Numerical summary, like a z score, calculated from sample data to assess evidence against the null hypothesis.
Alpha
Symbol representing the significance level, indicating the maximum acceptable probability of a Type I error.
Left Tail Probability
Area under the standard normal curve to the left of the test statistic, used for one-sided hypothesis tests.
Excel Function
Built-in tool, such as NORM.S.DIST or COUNTIF, used to automate calculations in hypothesis testing.
Sample Size
Number of observations in each group, crucial for calculating proportions and standard errors.
Standard Error
Measures the variability of the difference in sample proportions, used in the denominator of the z score formula.
Conclusion
Final decision in hypothesis testing, based on comparing the p value to alpha, about the validity of the null hypothesis.
 뒤로뒤로
뒤로뒤로

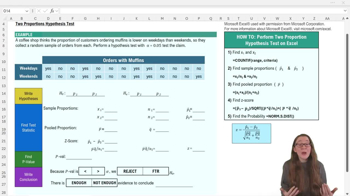
 09:31
09:31