Statistics for Business
나의 코스
배우기
시험 준비
AI 튜터
학습 가이드
플래시카드
탐험해 보세요
앱을 사용해 보세요
나의 코스
배우기
시험 준비
AI 튜터
학습 가이드
플래시카드
탐험해 보세요
앱을 사용해 보세요
뒤로
Two Proportions quiz
카드를 뒤집기 위해 탭할 수 있습니다.
What is the null hypothesis (H0) when testing two population proportions?
카드를 뒤집기 위해 탭할 수 있습니다.
👆
What is the null hypothesis (H0) when testing two population proportions?
The null hypothesis is that the two proportions are equal, or p1 = p2.
진행 상황 추적
컨트롤 버튼이 '내비게이션' 모드로 변경되었습니다.
1/15
관련 플래시카드
관련 실천
추천 영상
Two Proportions definitions
Two Proportions
15 용어
Two Proportions
10. Hypothesis Testing for Two Samples
10 문제점
주제
Justin
10. Hypothesis Testing for Two Samples - Part 1 of 2
3 주제
15 문제점
장
Ally
10. Hypothesis Testing for Two Samples - Part 2 of 2
3 주제
8 문제점
장
Justin
10:28
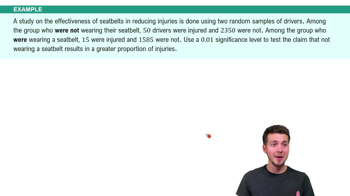
Difference in Proportions: Hypothesis Tests Example 1
199
views
3
rank
09:24
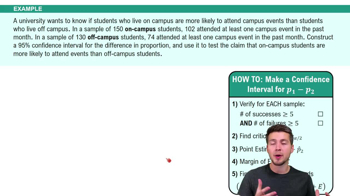
Difference in Proportions: Confidence Intervals Example 2
149
views
2
rank
05:01
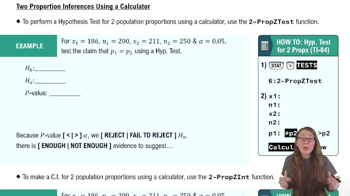
Two Proportions Inferences Using a TI-84
109
views
이 집합의 용어 (15)
하이드의 정의
What is the null hypothesis (H0) when testing two population proportions?
The null hypothesis is that the two proportions are equal, or p1 = p2.
How do you write the alternative hypothesis (Ha) if you are testing for any difference between two proportions?
The alternative hypothesis is p1 ≠ p2, indicating a two-tailed test.
What is the formula for the test statistic (z) in a two-proportion hypothesis test?
The formula is z = (p̂1 - p̂2) / sqrt[p̄q̄(1/n1 + 1/n2)], where p̄ is the pooled proportion.
How do you calculate the pooled proportion (p̄) for two samples?
Add all successes from both samples and divide by the total number of trials: p̄ = (x1 + x2) / (n1 + n2).
What conditions must be checked before performing a two-proportion z-test?
Each sample must be random and independent, and both must have at least 5 successes and 5 failures.
How do you calculate the sample proportions p̂1 and p̂2?
Divide the number of successes by the sample size for each group: p̂1 = x1/n1 and p̂2 = x2/n2.
What does it mean if the p-value is greater than the significance level (alpha) in a two-proportion test?
You fail to reject the null hypothesis, indicating there is not enough evidence of a difference.
How do you interpret a confidence interval for the difference in two proportions if it includes zero?
If zero is within the interval, you fail to reject the null hypothesis, suggesting no significant difference.
What is the point estimate when constructing a confidence interval for two proportions?
The point estimate is the difference in sample proportions: p̂1 - p̂2.
How is the margin of error (E) calculated for a confidence interval of two proportions?
E = z* × sqrt[(p̂1q̂1/n1) + (p̂2q̂2/n2)], using individual sample proportions, not the pooled proportion.
What critical value (z*) do you use for a 90% confidence interval?
The critical z value for a 90% confidence interval is 1.645.
When using a TI-84 calculator, which function is used for a two-proportion hypothesis test?
Use the 2-PropZTest function on the TI-84 calculator.
What does it mean if the confidence interval for p1 - p2 does not include zero?
It means there is enough evidence to suggest a significant difference between the two proportions.
How do you decide whether to reject the null hypothesis using the p-value?
If the p-value is less than alpha, reject the null hypothesis; otherwise, fail to reject it.
What is the relationship between hypothesis testing and confidence intervals for two proportions?
Both methods test for differences; if the confidence interval includes zero, you fail to reject H0, matching the hypothesis test result.