Skip to main content
Statistics for Business
나의 코스
배우기
시험 준비
AI 튜터
학습 가이드
플래시카드
탐험해 보세요
앱을 사용해 보세요
나의 코스
배우기
시험 준비
AI 튜터
학습 가이드
플래시카드
탐험해 보세요
앱을 사용해 보세요
뒤로
Two-Way ANOVA - Excel definitions
카드를 뒤집기 위해 탭할 수 있습니다.
Two-Way ANOVA
카드를 뒤집기 위해 탭할 수 있습니다.
👆
Two-Way ANOVA
Statistical method analyzing the influence of two factors and their interaction on group means within a dataset.
진행 상황 추적
컨트롤 버튼이 '내비게이션' 모드로 변경되었습니다.
1/15
관련 플래시카드
관련 실천
추천 영상
Two-Way ANOVA - Excel quiz
Two-Way ANOVA - Excel
15 용어
Two-Way ANOVA
14. ANOVA
5 문제점
주제
Justin
14. ANOVA - Part 1 of 2
1 주제
15 문제점
장
Ally
14. ANOVA - Part 2 of 2
3 주제
9 문제점
장
Justin
VideoThumbView.guidedCourse
08:34
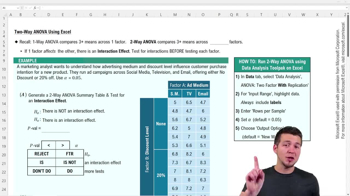
Two-Way ANOVA Using Excel
72
views
VideoThumbView.guidedCourse
09:46
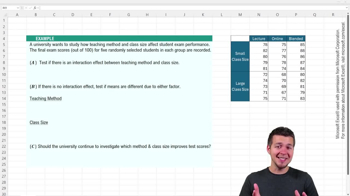
Two-Way ANOVA Using Excel Example 1
76
views
이 집합의 용어 (15)
하이드의 정의
Two-Way ANOVA
Statistical method analyzing the influence of two factors and their interaction on group means within a dataset.
Interaction Effect
Combined influence of two factors where their joint impact on means differs from their individual effects.
Factor
Categorical variable representing a condition or grouping, such as advertising medium or discount level.
Level
Specific category within a factor, like social media, TV, or email for advertising medium.
Null Hypothesis
Default assumption stating no effect or difference exists, such as no interaction or no mean difference.
P-Value
Probability measure used to decide whether to reject the null hypothesis at a chosen significance level.
Alpha Level
Threshold probability, often set at 0.05, determining the cutoff for statistical significance.
Replication
Use of multiple observations for each group combination, increasing reliability of ANOVA results.
Source of Variation
Component in ANOVA output identifying where differences in means may originate, such as factors or interaction.
F Statistic
Ratio comparing variance between groups to variance within groups, used to assess significance in ANOVA.
Data Analysis Toolpak
Excel add-in providing automated statistical calculations, including ANOVA summary tables.
Means
Average values for each group or combination, compared to detect differences across factors.
One-Way ANOVA
Statistical test comparing means across groups for a single factor, used when no interaction is present.
Summary Table
Excel output displaying statistics like sums, averages, variances, and ANOVA results for interpretation.
Hypothesis Test
Procedure for evaluating assumptions about population parameters using sample data and statistical evidence.
 뒤로뒤로
뒤로뒤로

 08:34
08:34