Skip to main content
Statistics for Business
나의 코스
배우기
시험 준비
AI 튜터
학습 가이드
플래시카드
탐험해 보세요
앱을 사용해 보세요
나의 코스
배우기
시험 준비
AI 튜터
학습 가이드
플래시카드
탐험해 보세요
앱을 사용해 보세요
뒤로
Uniform Distribution quiz
카드를 뒤집기 위해 탭할 수 있습니다.
What is the main difference between discrete and continuous random variables?
카드를 뒤집기 위해 탭할 수 있습니다.
👆
What is the main difference between discrete and continuous random variables?
Discrete random variables can only take specific, separate values, while continuous random variables can take any value within a range.
진행 상황 추적
컨트롤 버튼이 '내비게이션' 모드로 변경되었습니다.
1/15
관련 플래시카드
관련 실천
추천 영상
Uniform Distribution definitions
Uniform Distribution
15 용어
Uniform Distribution
6. Normal Distribution & Continuous Random Variables
7 문제점
주제
Ernest
Standard Normal Distribution
6. Normal Distribution & Continuous Random Variables
10 문제점
주제
Ernest
6. Normal Distribution & Continuous Random Variables
4 주제
15 문제점
장
Ernest
VideoThumbView.guidedCourse
02:50
Uniform Distribution Example 1
346
views
12
rank
VideoThumbView.guidedCourse
06:06
Uniform Distribution
638
views
6
rank
이 집합의 용어 (15)
하이드의 정의
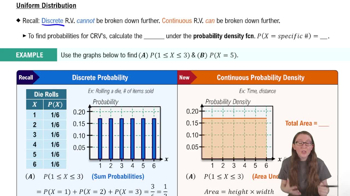
What is the main difference between discrete and continuous random variables?
Discrete random variables can only take specific, separate values, while continuous random variables can take any value within a range.
How are probabilities for discrete random variables typically represented?
They are usually shown in a table or a graph with bars for each possible value.
Why can't we list all possible values for a continuous random variable in a table?
Because there are infinitely many possible values within any range for a continuous random variable.
What is a probability density function (pdf)?
A pdf is a function used to represent the probabilities of a continuous random variable over a range of values.
How do you find the probability that a continuous random variable falls within a certain interval?
You calculate the area under the probability density function over that interval.
What is the total area under a probability density function for a continuous random variable?
The total area is always 1, representing 100% probability.
How do you find the probability that a discrete random variable equals a specific value?
You look up the probability assigned to that value in the table or graph.
What is the probability that a continuous random variable equals exactly a specific value?
The probability is zero because there are infinitely many possible values.
Why is the probability that a continuous random variable equals a specific value zero?
Because the probability is spread over an infinite number of possible values, making the probability for any single value effectively zero.
What is a uniform distribution?
A uniform distribution is a continuous distribution where the probability density function has the same height for all values within its range.
How can you tell if a distribution is uniform by looking at its graph?
If the probability density function has the same height for every possible value of x, it is a uniform distribution.
Is every continuous random variable uniformly distributed?
No, the uniform distribution is a special case; not all continuous random variables have a uniform distribution.
How do you calculate the probability that x is between two values in a uniform distribution?
Multiply the constant height of the pdf by the width of the interval between the two values.
What does the height of the probability density function represent in a uniform distribution?
It represents the constant probability density for all values within the range.
If the range of a uniform distribution is from 0 to 6, what is the height of the pdf?
The height is 1 divided by the width of the range, so 1/6.
 뒤로뒤로
뒤로뒤로
 02:50
02:50