Specifies the type of variable and the measurement scale used for each variable identified in a business problem.
Numerical vs. Categorical Variables
Numerical: data represent counted/measured quantities (discrete or continuous). Categorical: data represent categories or labels without inherent numeric meaning.
Discrete Numerical Variable
Data arising from a counting process, representing a number of something (e.g., number of smartphones sold).
Continuous Numerical Variable
Data arising from a measuring process, can take any value within an interval, limited by measurement precision (e.g., waiting time).
Measurement Scales for Numerical Variables
Interval scale: differences meaningful, no true zero. Ratio scale: ordered scale with a true zero point indicating absence of the variable.
Measurement Scales for Categorical Variables
Nominal scale: categories with no order. Ordinal scale: categories with a meaningful order but unequal intervals.
Population vs. Sample
Population: entire group of interest. Sample: subset of the population used to estimate characteristics.
Statistic vs. Parameter
Statistic: summary measure from a sample. Parameter: summary measure from a population.
Primary vs. Secondary Data Sources
Primary: data collected directly by the analyst. Secondary: data collected by others and used by the analyst.
Observational Study vs. Designed Experiment
Observational study: researcher observes without control. Designed experiment: researcher assigns treatments and controls conditions.
Frame in Sampling
A complete or partial listing of the population items from which a sample is drawn; critical to avoid bias.
Nonprobability vs. Probability Sampling
Nonprobability: selection without known probabilities; Probability: selection based on known probabilities allowing valid inference.
Simple Random Sampling (SRS)
Every item has equal chance of selection; every sample of size n equally likely; foundation for other sampling methods.
Systematic Sampling
Select every kth item from an ordered frame after a random start; faster but risks bias if hidden patterns align with k.
Stratified Sampling
Divide population into strata by shared characteristic, then sample randomly within each stratum; improves precision and representation.
Cluster Sampling
Divide population into clusters, randomly select clusters, and study all items within selected clusters; cost-effective for widespread populations.
Invalid Variable Values
Values that violate operational definitions and cannot be reasonably corrected; must be flagged or removed.
Coding Errors
Errors from data entry or processing that can often be corrected without external info (e.g., 'Female' instead of 'F').
Missing Values
Data values that were never collected or are absent; distinct from miscoded values.
Outliers
Numerical values excessively different from others; require review as they may affect statistical results.
Mean (Sample Mean)
Sum of all values divided by number of values; sensitive to outliers.
Median
Middle value in ordered data; resistant to outliers.
Mode
Most frequently occurring value; data can be unimodal, multimodal, or have no mode.
Range
Difference between largest and smallest values; simple but ignores distribution shape.
Variance and Standard Deviation
Measure spread by averaging squared deviations from the mean; SD is square root of variance and in original units.
Coefficient of Variation (CV)
Relative measure of variation expressed as a percentage; useful for comparing variability across different units.
Z-Score
Number of standard deviations a value is from the mean; used to identify outliers.
Skewness
Measure of asymmetry: negative (left-skewed), zero (symmetric), positive (right-skewed).
 뒤로
뒤로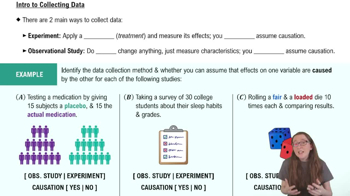
 4:01
4:01