Skip to main content
Calculus
나의 코스
배우기
시험 준비
AI 튜터
학습 가이드
교과서적 해결책
플래시카드
탐험해 보세요
앱을 사용해 보세요
나의 코스
배우기
시험 준비
AI 튜터
학습 가이드
교과서적 해결책
플래시카드
탐험해 보세요
앱을 사용해 보세요
뒤로
Graphs of Trigonometric Functions quiz
카드를 뒤집기 위해 탭할 수 있습니다.
What is the starting value of the sine graph at x = 0, and how does it progress through one period?
카드를 뒤집기 위해 탭할 수 있습니다.
👆
What is the starting value of the sine graph at x = 0, and how does it progress through one period?
The sine graph starts at 0, reaches 1 at π/2, returns to 0 at π, drops to -1 at 3π/2, and returns to 0 at 2π.
진행 상황 추적
컨트롤 버튼이 '내비게이션' 모드로 변경되었습니다.
1/15
관련 플래시카드
관련 실천
추천 영상
Graphs of Trigonometric Functions definitions
Graphs of Trigonometric Functions
15 용어
Graphs of Trigonometric Functions
0. Functions
3 문제점
주제
Jonathan
Trigonometric Identities
0. Functions
2 문제점
주제
0. Functions - Part 1 of 2
7 주제
14 문제점
장
Patrick
0. Functions - Part 2 of 2
8 주제
12 문제점
장
David-Paige
VideoThumbView.guidedCourse
5:53
Graph of Sine and Cosine Function
1626
views
32
rank
VideoThumbView.guidedCourse
3:15
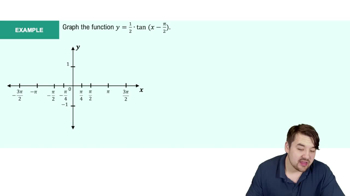
Introduction to Tangent Graph Example 1
847
views
12
rank
1
comments
VideoThumbView.guidedCourse
5:37
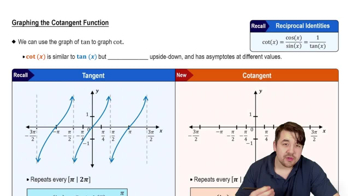
Introduction to Cotangent Graph
926
views
9
rank
이 집합의 용어 (15)
하이드의 정의
What is the starting value of the sine graph at x = 0, and how does it progress through one period?
The sine graph starts at 0, reaches 1 at π/2, returns to 0 at π, drops to -1 at 3π/2, and returns to 0 at 2π.
How does the cosine graph differ from the sine graph in terms of starting value and progression?
The cosine graph starts at 1 when x = 0, drops to 0 at π/2, reaches -1 at π, returns to 0 at 3π/2, and back to 1 at 2π.
What are the terms for the highest and lowest points on a sine or cosine graph?
The highest points are called peaks or crests, and the lowest points are called valleys or troughs.
How does adding a positive constant k to a sine or cosine function affect its graph?
Adding a positive constant shifts the entire graph vertically upward by k units without changing its shape.
What is the reciprocal of the sine function, and what is a key feature of its graph?
The reciprocal of sine is cosecant (csc), and its graph has vertical asymptotes wherever sine equals zero.
Where do the asymptotes of the secant function occur, and why?
Secant's asymptotes occur where cosine equals zero, because secant is undefined at those points.
How do the graphs of cosecant and secant relate to the graphs of sine and cosine?
Cosecant and secant graphs are formed by taking the reciprocal of the sine and cosine graphs, respectively, and share their peaks and valleys.
What is the period of the sine and cosine functions, and how is it calculated if the function is y = sin(bx) or y = cos(bx)?
The period is 2π for the basic functions, and for y = sin(bx) or y = cos(bx), the period is 2π divided by b.
How is the tangent function defined in terms of sine and cosine, and where are its asymptotes?
Tangent is defined as sine divided by cosine, and its asymptotes occur where cosine equals zero (odd multiples of π/2).
What is the period of the tangent function, and how does it differ from sine and cosine?
The period of tangent is π, which is half the period of sine and cosine (2π).
How do you find the period of y = tan(bx)?
The period is π divided by b for y = tan(bx).
What is the reciprocal of the tangent function, and what is a key feature of its graph?
The reciprocal of tangent is cotangent (cot), and its graph has vertical asymptotes where tangent equals zero (integer multiples of π).
How does the orientation of the cotangent graph differ from the tangent graph?
The cotangent graph decreases from left to right between asymptotes, while the tangent graph increases.
Where are the asymptotes of the cotangent function located?
Cotangent's asymptotes are at integer multiples of π (e.g., ..., -2π, -π, 0, π, 2π, ...).
What is the period of the cotangent function, and how is it calculated for y = cot(bx)?
The period of cotangent is π, and for y = cot(bx), it is π divided by b.
 뒤로
뒤로


 5:53
5:53