Skip to main content
Calculus
나의 코스
배우기
시험 준비
AI 튜터
학습 가이드
교과서적 해결책
플래시카드
탐험해 보세요
앱을 사용해 보세요
나의 코스
배우기
시험 준비
AI 튜터
학습 가이드
교과서적 해결책
플래시카드
탐험해 보세요
앱을 사용해 보세요
뒤로
Properties of Functions definitions
카드를 뒤집기 위해 탭할 수 있습니다.
Maximum Value
카드를 뒤집기 위해 탭할 수 있습니다.
👆
Maximum Value
The highest output a function attains, occurring at a specific input where all other outputs are less than or equal to this value.
진행 상황 추적
컨트롤 버튼이 '내비게이션' 모드로 변경되었습니다.
1/15
관련 플래시카드
관련 실천
추천 영상
Properties of Functions quiz
Properties of Functions
15 용어
Properties of Functions
0. Functions
3 문제점
주제
David-Paige
Common Functions
0. Functions
4 문제점
주제
Patrick
0. Functions - Part 1 of 2
7 주제
14 문제점
장
Patrick
0. Functions - Part 2 of 2
8 주제
12 문제점
장
David-Paige
VideoThumbView.guidedCourse
06:21
Properties of Functions
2645
views
80
rank
이 집합의 용어 (15)
하이드의 정의
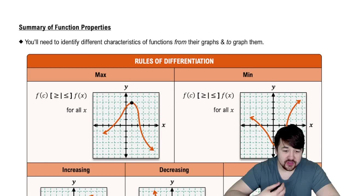
Maximum Value
The highest output a function attains, occurring at a specific input where all other outputs are less than or equal to this value.
Minimum Value
The lowest output a function reaches, found at an input where all other outputs are greater than or equal to this value.
Increasing Function
A graph where outputs rise as inputs move from left to right, resembling an upward walk along the curve.
Decreasing Function
A graph where outputs fall as inputs move from left to right, similar to a downward walk along the curve.
Constant Function
A graph that remains flat, producing the same output for every input, with no upward or downward trend.
Y-Axis Symmetry
A property where folding the graph along the y-axis aligns both sides perfectly, indicating identical outputs for opposite inputs.
Even Function
A function where substituting a negative input yields the same output as the positive input, reflecting y-axis symmetry.
Origin Symmetry
A property where folding the graph over both axes aligns it, showing that outputs are mirrored and sign-reversed for opposite inputs.
Odd Function
A function where the output for a negative input is the negative of the output for the positive input, reflecting origin symmetry.
X-Axis Symmetry
A property where folding the graph along the x-axis aligns both sides, but this pattern never represents a function.
Vertical Line Test
A method to determine if a graph represents a function by checking if any vertical line crosses the graph more than once.
Output
The value produced by a function for a given input, often represented as the y-value on a graph.
Input
The value substituted into a function, typically represented as the x-value on a graph.
Graph
A visual representation of a function, illustrating the relationship between inputs and outputs.
Symmetry
A characteristic where a graph remains unchanged after specific folds or reflections, revealing patterns in function behavior.
 뒤로뒤로
뒤로뒤로

 06:21
06:21