If ƒ(x) = √x and g(x) = x³-2 and , simplify the expressions (ƒ o g) (3), (ƒ o ƒ) (64), (g o ƒ) (x) and (ƒ o g) (x)
Ch. 1 - Functions
1장, 문제 11
How do you obtain the graph of from the graph of ?
검증된 단계별 안내1
Start by understanding the transformation involved. The function y = f(3x) represents a horizontal compression of the graph of y = f(x).
Recall that multiplying the input of a function by a constant greater than 1 compresses the graph horizontally. In this case, the factor is 3.
To visualize this, consider any point (a, b) on the graph of y = f(x). For the graph of y = f(3x), this point will be transformed to (a/3, b).
This means that every x-coordinate on the graph of y = f(x) is divided by 3 to obtain the corresponding x-coordinate on the graph of y = f(3x).
Finally, sketch the new graph by applying this transformation to key points and features of the original graph, such as intercepts and turning points, to see the compressed version.

비슷한 문제에 대한 검증된 영상 답변:
이 영상 해법은 위 문제에 도움이 된다고 튜터들이 추천한 것입니다.
영상 길이:
8m주요 개념
질문에 올바르게 답하기 위해 반드시 이해해야 하는 핵심 개념들은 다음과 같습니다.
Function Transformation
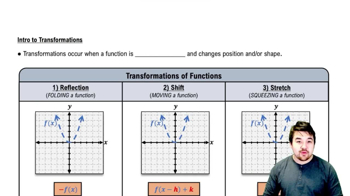
Function transformation refers to the process of altering the graph of a function through various operations, such as shifting, stretching, or compressing. In this case, the transformation involves replacing the input variable 'x' with '3x', which compresses the graph horizontally by a factor of 3. Understanding how these transformations affect the graph is crucial for accurately sketching the new function.
추천 영상:
가이드 코스
Intro to Transformations
Horizontal Compression
Horizontal compression occurs when the input of a function is multiplied by a factor greater than 1, resulting in the graph being 'squeezed' towards the y-axis. For the function y = f(3x), the factor of 3 compresses the graph horizontally, meaning that points on the original graph will be closer together on the new graph. This concept is essential for predicting how the shape of the graph changes.
추천 영상:
가이드 코스
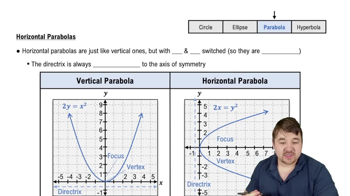
Horizontal Parabolas
Graphing Techniques
Graphing techniques involve methods used to accurately represent functions visually. This includes understanding the original function's key features, such as intercepts and asymptotes, and applying transformations systematically. By mastering these techniques, one can effectively sketch the transformed graph of y = f(3x) based on the original graph of y = f(x).
추천 영상:
가이드 코스
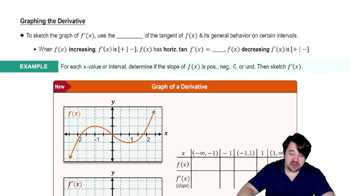
Graphing The Derivative
관련 실천
교과서 질문
367
views
교과서 질문
The parabola y=x²+1 consists of two one-to-one functions, g₁(x) and g₂(x). Complete each exercise and confirm that your answers are consistent with the graphs displayed in the figure. <IMAGE>
Find formulas for g₁((x) and g₁⁻¹(x). State the domain and range of each function.
1054
views
교과서 질문
Evaluating functions from graphs Assume ƒ is an odd function and that both ƒ and g are one-to-one. Use the (incomplete) graph of ƒ and g the graph of to find the following function values. <IMAGE>
ƒ(g(4))
553
views
교과서 질문
Find functions ƒand g such that ƒ(g(x)) = (x² +1)⁵ . Find a different pair of functions ƒ and g that also satisfy ƒ(g(x)) = (x² +1)⁵
368
views
1
rank
교과서 질문
How do you obtain the graph of from the graph of ?
402
views
교과서 질문
Solve the equation sin 2Θ = 1, for 0 ≤ Θ < 2π .
321
views