Ch. 2 - Limits
Briggs - Calculus: Early Transcendentals 3rd Edition
Briggs3rd EditionCalculus: Early TranscendentalsISBN: 9780136847243당신이 사용하는 게 아니라요?교과서 변경
2장, 문제 18d

Use the graph of g(x)g(x) in the figure to find the following values or state that they do not exist. If a limit does not exist, explain why. <IMAGE>


limx2g(x)\(\lim\)_{x\(\to\)2}g\(\left\)(x\(\right\))

검증된 단계별 안내
1
Examine the graph of g(x) around x = 2 to understand the behavior of the function as x approaches 2 from both the left and the right.
Identify the left-hand limit, \( \lim_{x \to 2^-} g(x) \), by observing the values that g(x) approaches as x approaches 2 from the left side.
Identify the right-hand limit, \( \lim_{x \to 2^+} g(x) \), by observing the values that g(x) approaches as x approaches 2 from the right side.
Compare the left-hand limit and the right-hand limit. If both limits are equal, then the limit \( \lim_{x \to 2} g(x) \) exists and is equal to this common value.
If the left-hand limit and the right-hand limit are not equal, then the limit \( \lim_{x \to 2} g(x) \) does not exist, and you should explain that the discrepancy between the two limits is the reason for the non-existence.

비슷한 문제에 대한 검증된 영상 답변:

이 영상 해법은 위 문제에 도움이 된다고 튜터들이 추천한 것입니다.
영상 길이:
5m

주요 개념

질문에 올바르게 답하기 위해 반드시 이해해야 하는 핵심 개념들은 다음과 같습니다.

Limits

A limit is a fundamental concept in calculus that describes the behavior of a function as its input approaches a certain value. It helps in understanding the function's value at points where it may not be explicitly defined. For example, the limit of g(x) as x approaches 2 examines how g(x) behaves near x = 2, which is crucial for determining continuity and differentiability.
추천 영상:
05:50
One-Sided Limits

Continuity

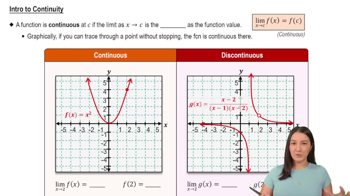
Continuity of a function at a point means that the function is defined at that point, the limit exists, and the limit equals the function's value at that point. If g(x) is continuous at x = 2, then the limit as x approaches 2 will equal g(2). Discontinuities can arise from jumps, holes, or vertical asymptotes, affecting the existence of limits.
추천 영상:
05:34
Intro to Continuity

Graphical Interpretation

Graphical interpretation involves analyzing the visual representation of a function to understand its behavior. By examining the graph of g(x), one can identify limits, continuity, and points of discontinuity. This visual approach aids in determining whether the limit as x approaches 2 exists and provides insight into the function's overall behavior near that point.
추천 영상:
05:02
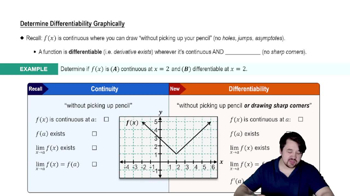
Determining Differentiability Graphically