Ch. 3 - Derivatives
Briggs - Calculus: Early Transcendentals 3rd Edition
Briggs3rd EditionCalculus: Early TranscendentalsISBN: 9780136847243당신이 사용하는 게 아니라요?교과서 변경
3장, 문제 66e

Population growth Consider the following population functions.
e.Use a graphing utility to graph the population and its growth rate.
p(t) = 600 (t²+3/t²+9)

검증된 단계별 안내
1
Step 1: Identify the function for the population, which is given as \( p(t) = 600 \left( \frac{t^2 + 3}{t^2 + 9} \right) \). This function represents the population at time \( t \).
Step 2: To find the growth rate of the population, we need to compute the derivative of \( p(t) \) with respect to \( t \). This involves using the quotient rule for derivatives, which is \( \frac{d}{dt} \left( \frac{u}{v} \right) = \frac{u'v - uv'}{v^2} \), where \( u = t^2 + 3 \) and \( v = t^2 + 9 \).
Step 3: Calculate the derivatives \( u' \) and \( v' \). For \( u = t^2 + 3 \), \( u' = 2t \). For \( v = t^2 + 9 \), \( v' = 2t \).
Step 4: Substitute \( u, v, u', \) and \( v' \) into the quotient rule formula to find \( p'(t) \), the growth rate of the population. This gives \( p'(t) = 600 \left( \frac{(2t)(t^2 + 9) - (t^2 + 3)(2t)}{(t^2 + 9)^2} \right) \).
Step 5: Simplify the expression for \( p'(t) \) to obtain a more manageable form for graphing. This involves expanding and combining like terms in the numerator, and then simplifying the entire expression.

비슷한 문제에 대한 검증된 영상 답변:

이 영상 해법은 위 문제에 도움이 된다고 튜터들이 추천한 것입니다.
영상 길이:
3m
도움이 되었나요?

주요 개념

질문에 올바르게 답하기 위해 반드시 이해해야 하는 핵심 개념들은 다음과 같습니다.

Population Functions

Population functions model the growth of a population over time, often represented as p(t), where t is time. In this case, the function p(t) = 600(t² + 3)/(t² + 9) describes how the population changes based on the variable t. Understanding the structure of this function is crucial for analyzing its behavior and growth patterns.
추천 영상:
가이드 코스
06:21
Properties of Functions

Graphing Utilities

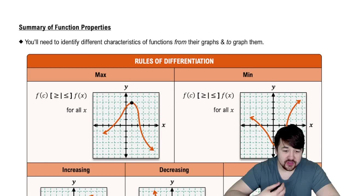
Graphing utilities are software tools or calculators that allow users to visualize mathematical functions. They can plot graphs of equations, helping to illustrate the relationship between variables. Using a graphing utility to plot the population function and its growth rate provides a visual representation that aids in understanding trends and behaviors in population dynamics.
추천 영상:
가이드 코스
06:15
Graphing The Derivative

Growth Rate

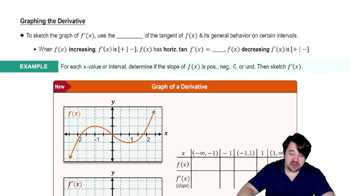
The growth rate of a population refers to the change in population size over time, often expressed as a derivative of the population function. For the given function, calculating the derivative p'(t) will yield the growth rate, indicating how quickly the population is increasing or decreasing at any point in time. Analyzing the growth rate is essential for understanding the dynamics of population change.
추천 영상:
가이드 코스
04:16
Intro To Related Rates