Ch. 3 - Derivatives
Briggs - Calculus: Early Transcendentals 3rd Edition
Briggs3rd EditionCalculus: Early TranscendentalsISBN: 9780136847243당신이 사용하는 게 아니라요?교과서 변경
3장, 문제 3.R.96b

{Use of Tech} Beak length The length of the culmen (the upper ridge of a bird’s bill) of a t-week-old Indian spotted owlet is modeled by the function L(t)=11.94 / 1 + 4e^−1.65t, where L is measured in millimeters.
b. Use a graph of L′(t) to describe how the culmen grows over the first 5 weeks of life.

검증된 단계별 안내
1
First, understand that L(t) is a function that models the length of the culmen of an owlet over time. The function is given as L(t) = \(\frac{11.94}{1 + 4e^{-1.65t}}\). Our task is to analyze the growth rate of the culmen by examining the derivative L'(t).
To find L'(t), we need to differentiate L(t) with respect to t. This involves using the quotient rule for differentiation, which is given by \(\frac{d}{dt}\left(\frac{u}{v}\right) = \frac{v \cdot u' - u \cdot v'}{v^2}\), where u = 11.94 and v = 1 + 4e^{-1.65t}.
Calculate the derivatives u' and v'. Since u is a constant, u' = 0. For v, use the chain rule to find v' = \(-4 \cdot (-1.65) \cdot e^{-1.65t}\). Simplify this to v' = 6.6e^{-1.65t}.
Substitute u, u', v, and v' into the quotient rule formula to find L'(t). This will give you the expression for the rate of change of the culmen length with respect to time.
Finally, use a graphing tool to plot L'(t) over the interval from t = 0 to t = 5. Analyze the graph to describe how the growth rate of the culmen changes over the first 5 weeks. Look for trends such as increasing, decreasing, or constant growth rates.

비슷한 문제에 대한 검증된 영상 답변:

이 영상 해법은 위 문제에 도움이 된다고 튜터들이 추천한 것입니다.
영상 길이:
5m

주요 개념

질문에 올바르게 답하기 위해 반드시 이해해야 하는 핵심 개념들은 다음과 같습니다.

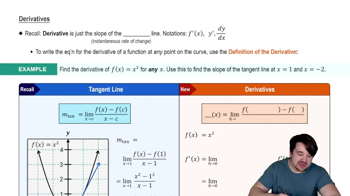
Derivative

The derivative of a function measures the rate at which the function's value changes as its input changes. In this context, L'(t) represents the growth rate of the culmen length over time, indicating how quickly the length is increasing or decreasing at any given moment.
추천 영상:

Graphing Functions

Graphing functions involves plotting the values of a function on a coordinate system to visualize its behavior. For L'(t), the graph will show how the growth rate of the culmen changes over the first five weeks, helping to identify periods of rapid growth or stagnation.
추천 영상:
가이드 코스
5:53
Graph of Sine and Cosine Function

Exponential Functions

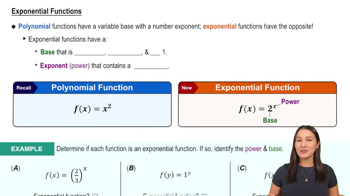
Exponential functions are characterized by a constant base raised to a variable exponent, often representing growth or decay processes. The function L(t) includes an exponential term, which influences the growth pattern of the culmen length, particularly in the early stages of the owlet's life.
추천 영상:
6:13
Exponential Functions