Ch. 4 - Applications of the Derivative
Briggs - Calculus: Early Transcendentals 3rd Edition
Briggs3rd EditionCalculus: Early TranscendentalsISBN: 9780136847243당신이 사용하는 게 아니라요?교과서 변경
4장, 문제 4.4.51

49–54. {Use of Tech} Graphing with technology Make a complete graph of the following functions. A graphing utility is useful in locating intercepts, local extreme values, and inflection points.


ƒ(x) = 3x⁴ + 4x³ - 12x²

검증된 단계별 안내
1
Step 1: Begin by identifying the key features of the function ƒ(x) = 3x⁴ + 4x³ - 12x². These include intercepts, local extreme values, and inflection points. To find the x-intercepts, set ƒ(x) = 0 and solve for x.
Step 2: Calculate the first derivative ƒ'(x) to find critical points, which are potential locations for local extreme values. The first derivative is given by ƒ'(x) = d/dx(3x⁴ + 4x³ - 12x²). Use the power rule to differentiate each term.
Step 3: Set the first derivative ƒ'(x) equal to zero and solve for x to find critical points. These points will help identify local maxima and minima. Also, consider the endpoints of the domain if applicable.
Step 4: Calculate the second derivative ƒ''(x) to determine concavity and locate inflection points. The second derivative is given by ƒ''(x) = d²/dx²(3x⁴ + 4x³ - 12x²). Again, use the power rule to differentiate.
Step 5: Use a graphing utility to plot the function ƒ(x) = 3x⁴ + 4x³ - 12x². Analyze the graph to confirm the locations of intercepts, local extreme values, and inflection points. Adjust the viewing window to ensure all relevant features are visible.

비슷한 문제에 대한 검증된 영상 답변:

이 영상 해법은 위 문제에 도움이 된다고 튜터들이 추천한 것입니다.
영상 길이:
13m
도움이 되었나요?

주요 개념

질문에 올바르게 답하기 위해 반드시 이해해야 하는 핵심 개념들은 다음과 같습니다.

Graphing Functions

Graphing functions involves plotting the curve of a mathematical function on a coordinate plane. This helps visualize the behavior of the function, including its intercepts, local extrema, and inflection points. Technology, such as graphing calculators or software, can assist in accurately plotting complex functions like polynomials.
추천 영상:
가이드 코스
5:53
Graph of Sine and Cosine Function

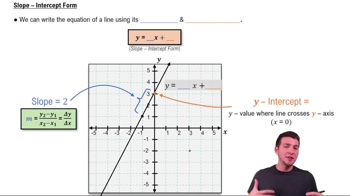
Intercepts

Intercepts are points where the graph of a function crosses the axes. The x-intercepts occur where the function equals zero, and the y-intercept is where the function crosses the y-axis. Identifying intercepts is crucial for understanding the function's behavior and is often facilitated by graphing utilities.
추천 영상:
3:56
Slope-Intercept Form

Local Extrema and Inflection Points

Local extrema are points where a function reaches a local maximum or minimum. Inflection points are where the function's curvature changes direction. These points are critical for understanding the function's shape and behavior, and graphing technology can help locate them by analyzing the derivative and second derivative of the function.
추천 영상:
04:50
Critical Points