Explain the Mean Value Theorem with a sketch.
Ch. 4 - Applications of the Derivative
4장, 문제 4.4.26
Graphing functions Use the guidelines of this section to make a complete graph of f.
f(x) = x³ - 147x + 286
검증된 단계별 안내1
Identify the critical points of the function by finding the derivative of f(x) = x³ - 147x + 286. Set the derivative equal to zero to find the critical points.
Calculate the derivative: f'(x) = 3x² - 147. Set this equal to zero and solve for x to find the critical points: 3x² - 147 = 0.
Solve the equation 3x² - 147 = 0 for x. This will give you the x-values of the critical points.
Determine the nature of each critical point by using the second derivative test. Calculate the second derivative: f''(x) = 6x, and evaluate it at each critical point.
Analyze the behavior of the function as x approaches positive and negative infinity to understand the end behavior of the graph. This will help in sketching the complete graph of the function.

비슷한 문제에 대한 검증된 영상 답변:
이 영상 해법은 위 문제에 도움이 된다고 튜터들이 추천한 것입니다.
영상 길이:
10m도움이 되었나요?
주요 개념
질문에 올바르게 답하기 위해 반드시 이해해야 하는 핵심 개념들은 다음과 같습니다.
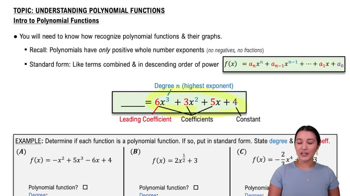
Polynomial Functions
A polynomial function is a mathematical expression involving a sum of powers in one or more variables multiplied by coefficients. The function f(x) = x³ - 147x + 286 is a cubic polynomial, characterized by its highest degree of 3. Understanding the general shape and behavior of polynomial functions is essential for graphing them accurately.
추천 영상:
Introduction to Polynomial Functions
Critical Points and Extrema
Critical points occur where the derivative of a function is zero or undefined, indicating potential local maxima, minima, or points of inflection. To find these points for f(x), we need to compute its derivative, set it to zero, and solve for x. Analyzing these points helps in determining the overall shape and turning behavior of the graph.
추천 영상:
Critical Points
End Behavior of Functions
End behavior describes how a function behaves as the input values approach positive or negative infinity. For cubic functions like f(x), the end behavior is determined by the leading term, which in this case is x³. As x approaches infinity, f(x) also approaches infinity, and as x approaches negative infinity, f(x) approaches negative infinity, shaping the overall graph.
추천 영상:
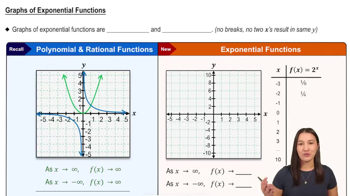
Graphs of Exponential Functions
관련 실천
교과서 질문
280
views
교과서 질문
17–83. Limits Evaluate the following limits. Use l’Hôpital’s Rule when it is convenient and applicable.
lim_z→∞ (1 + 10/z²)ᶻ²
265
views
교과서 질문
Particular antiderivatives For the following functions f, find the antiderivative F that satisfies the given condition.
f(v) = sec v tan v; F(0) = 2, -π/2 < v < π/2
60
views
교과서 질문
Designer functions Sketch the graph of a function f that is continuous on (-∞,∞) and satisfies the following sets of conditions.
f'(x) > 0, for all x in the domain of f'; f'(-2) and f'(1) do not exist; f"(0) = 0
204
views
교과서 질문
Locating critical points Find the critical points of the following functions. Assume a is a nonzero constant.
ƒ(x) = x² √(x + 5)
211
views
교과서 질문
Graphing functions Use the guidelines of this section to make a complete graph of f.
f(x) = x² - 6x
309
views