Ch. 4 - Applications of the Derivative
Briggs - Calculus: Early Transcendentals 3rd Edition
Briggs3rd EditionCalculus: Early TranscendentalsISBN: 9780136847243당신이 사용하는 게 아니라요?교과서 변경
4장, 문제 107a

Interpreting the derivative The graph of f' on the interval [-3,2] is shown in the figure. <IMAGE>


a. On what interval(s) is f increasing? Decreasing?

검증된 단계별 안내
1
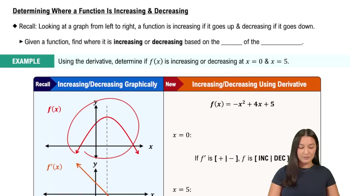
To determine where the function f is increasing or decreasing, we need to analyze the sign of its derivative f'. A function f is increasing on intervals where f' is positive and decreasing where f' is negative.
Examine the graph of f' over the interval [-3, 2]. Identify the sections where the graph of f' is above the x-axis (positive) and where it is below the x-axis (negative).
List the intervals where f' is positive. These intervals correspond to where the function f is increasing.
List the intervals where f' is negative. These intervals correspond to where the function f is decreasing.
Ensure to consider any points where f' crosses the x-axis, as these are points where the behavior of f changes from increasing to decreasing or vice versa.

비슷한 문제에 대한 검증된 영상 답변:

이 영상 해법은 위 문제에 도움이 된다고 튜터들이 추천한 것입니다.
영상 길이:
3m

주요 개념

질문에 올바르게 답하기 위해 반드시 이해해야 하는 핵심 개념들은 다음과 같습니다.

Derivative and Its Interpretation

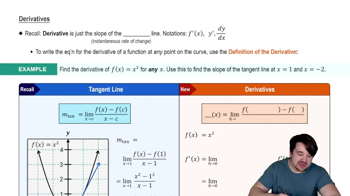
The derivative of a function, denoted as f', represents the rate of change of the function f with respect to its variable. It provides critical information about the function's behavior, specifically whether it is increasing or decreasing. When f' is positive, the function f is increasing; when f' is negative, f is decreasing.
추천 영상:

Critical Points

Critical points occur where the derivative f' is zero or undefined. These points are essential for determining intervals of increase and decrease, as they can indicate potential local maxima or minima. Analyzing the sign of the derivative around these points helps in understanding the overall behavior of the function.
추천 영상:
04:50
Critical Points

Sign Chart

A sign chart is a visual tool used to determine the intervals where a function is increasing or decreasing based on the sign of its derivative. By plotting the critical points and testing intervals between them, one can easily see where the derivative is positive (indicating increase) or negative (indicating decrease), thus providing a clear picture of the function's behavior over the specified interval.
추천 영상:
07:32
Determining Where a Function is Increasing & Decreasing