Ch. 4 - Applications of the Derivative
Briggs - Calculus: Early Transcendentals 3rd Edition
Briggs3rd EditionCalculus: Early TranscendentalsISBN: 9780136847243당신이 사용하는 게 아니라요?교과서 변경
4장, 문제 4.R.2c

Locating extrema Consider the graph of a function ƒ on the interval [-3, 3]. <IMAGE>
c. Give the approximate coordinates of the inflection point(s) of f.

검증된 단계별 안내
1
Understand that an inflection point is where the function changes concavity, which means the second derivative changes sign.
Examine the graph visually to identify where the curve changes from concave up to concave down or vice versa.
Look for points on the graph where the slope of the tangent line changes from increasing to decreasing or vice versa, indicating a change in concavity.
Estimate the x-coordinate of the inflection point by observing the graph and noting where this change occurs.
Approximate the y-coordinate by finding the corresponding value of the function at the estimated x-coordinate.

비슷한 문제에 대한 검증된 영상 답변:

이 영상 해법은 위 문제에 도움이 된다고 튜터들이 추천한 것입니다.
영상 길이:
2m
도움이 되었나요?

주요 개념

질문에 올바르게 답하기 위해 반드시 이해해야 하는 핵심 개념들은 다음과 같습니다.

Inflection Points

Inflection points are points on the graph of a function where the curvature changes direction. This means that the second derivative of the function changes sign at these points. Identifying inflection points is crucial for understanding the behavior of the function, particularly in determining where it transitions from concave up to concave down or vice versa.
추천 영상:
04:50
Critical Points

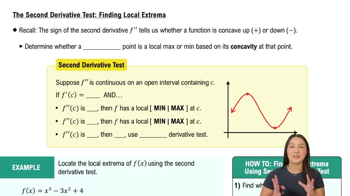
Second Derivative Test

The second derivative test is a method used to determine the concavity of a function at a given point. If the second derivative is positive, the function is concave up, and if it is negative, the function is concave down. An inflection point occurs where the second derivative equals zero or is undefined, indicating a potential change in concavity.
추천 영상:
06:02
The Second Derivative Test: Finding Local Extrema

Graphical Analysis

Graphical analysis involves examining the visual representation of a function to identify key features such as extrema, inflection points, and intervals of increase or decrease. By analyzing the graph, one can estimate the coordinates of inflection points and understand the overall behavior of the function across the specified interval.
추천 영상:
05:02
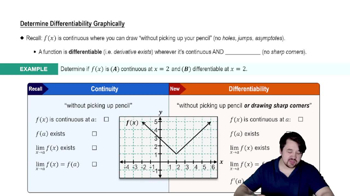
Determining Differentiability Graphically