Ch. 2 - Limits and Continuity
Hass - Thomas' Calculus 15th Edition
Hass15th EditionThomas' CalculusISBN: 9780137616077당신이 사용하는 게 아니라요?교과서 변경
2장, 문제 2.2.71b

Estimating Limits


[Technology Exercise] You will find a graphing calculator useful for Exercises 67–74.


Let f(x)=(x² − 1)/(|x| − 1).


b. Support your conclusion in part (a) by graphing f near c = -1 and using Zoom and Trace to estimate y-values on the graph as x→−1.

검증된 단계별 안내
1
First, understand the function f(x) = (x² − 1)/(|x| − 1). This function involves an absolute value in the denominator, which can affect the behavior of the function around x = -1.
To analyze the limit as x approaches -1, consider the behavior of the function from both sides of x = -1. This means evaluating the function as x approaches -1 from the left (x → -1⁻) and from the right (x → -1⁺).
Graph the function using a graphing calculator. Set the window to focus on values of x near -1, such as from -1.5 to -0.5, to observe the behavior of the function around this point.
Use the Zoom feature to get a closer look at the graph near x = -1. This will help you see how the function behaves as x approaches -1 from both sides.
Utilize the Trace feature on the graphing calculator to estimate the y-values of the function as x approaches -1. This will provide a visual approximation of the limit by observing the values that f(x) approaches as x gets closer to -1.

비슷한 문제에 대한 검증된 영상 답변:

이 영상 해법은 위 문제에 도움이 된다고 튜터들이 추천한 것입니다.
영상 길이:
1m
도움이 되었나요?

주요 개념

질문에 올바르게 답하기 위해 반드시 이해해야 하는 핵심 개념들은 다음과 같습니다.

Limits

A limit is a fundamental concept in calculus that describes the behavior of a function as its input approaches a certain value. It helps in understanding how functions behave near points of interest, including points of discontinuity or where they are not defined. For example, evaluating the limit of f(x) as x approaches -1 allows us to determine the function's value or behavior at that point.
추천 영상:
05:50
One-Sided Limits

Graphing Functions

Graphing functions involves plotting the values of a function on a coordinate plane to visualize its behavior. This technique is essential for understanding limits, as it allows us to see how the function behaves as it approaches a specific x-value. Using tools like graphing calculators can enhance this process by providing precise visual representations and enabling the estimation of y-values as x approaches a limit.
추천 영상:
5:53
Graph of Sine and Cosine Function

Continuity and Discontinuity

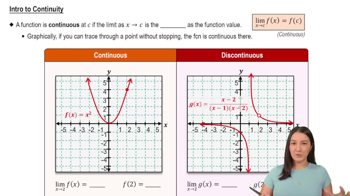
Continuity refers to a function being unbroken and having no gaps at a point, meaning the limit at that point equals the function's value. Discontinuity occurs when a function has a break, jump, or point where it is not defined. Understanding whether f(x) is continuous or discontinuous at x = -1 is crucial for accurately estimating limits and interpreting the function's behavior near that point.
추천 영상:
05:34
Intro to Continuity