Ch. 2 - Limits and Continuity
Hass - Thomas' Calculus 15th Edition
Hass15th EditionThomas' CalculusISBN: 9780137616077당신이 사용하는 게 아니라요?교과서 변경
2장, 문제 2.2.70b

Estimating Limits


[Technology Exercise] You will find a graphing calculator useful for Exercises 67–74.


Let h(x)=(x² − 2x − 3)/(x² − 4x + 3)


b. Support your conclusions in part (a) by graphing h near c = 3 and using Zoom and Trace to estimate y-values on the graph as x→3.

검증된 단계별 안내
1
First, understand the function h(x) = (x² − 2x − 3)/(x² − 4x + 3). This is a rational function, which means it is the ratio of two polynomials.
Identify any points of discontinuity by setting the denominator equal to zero: x² − 4x + 3 = 0. Solve this quadratic equation to find the values of x that make the denominator zero.
Factor the denominator: x² − 4x + 3 = (x - 3)(x - 1). The function h(x) is undefined at x = 3 and x = 1, which are the points of discontinuity.
To estimate the limit as x approaches 3, use a graphing calculator to plot the function h(x). Use the Zoom feature to focus on the area around x = 3.
Utilize the Trace feature on the graphing calculator to observe the behavior of the y-values as x approaches 3 from both sides. This will help you estimate the limit of h(x) as x approaches 3.

비슷한 문제에 대한 검증된 영상 답변:

이 영상 해법은 위 문제에 도움이 된다고 튜터들이 추천한 것입니다.
영상 길이:
2m
도움이 되었나요?

주요 개념

질문에 올바르게 답하기 위해 반드시 이해해야 하는 핵심 개념들은 다음과 같습니다.

Limits

Limits are fundamental in calculus, representing the value that a function approaches as the input approaches a certain point. In this context, understanding limits helps in analyzing the behavior of the function h(x) as x approaches 3, which is crucial for determining continuity and potential discontinuities in the function.
추천 영상:
05:50
One-Sided Limits

Graphing Functions

Graphing functions involves plotting the values of a function on a coordinate plane, which visually represents its behavior. In this exercise, using a graphing calculator to visualize h(x) near x = 3 allows for a better understanding of how the function behaves around that point, aiding in the estimation of limits.
추천 영상:
5:53
Graph of Sine and Cosine Function

Zoom and Trace Features

The Zoom and Trace features on a graphing calculator allow users to adjust the viewing window and track the values of a function as the input changes. This is particularly useful for estimating y-values as x approaches a specific point, such as 3 in this case, providing a practical method to support conclusions drawn from limit analysis.
추천 영상:
05:34
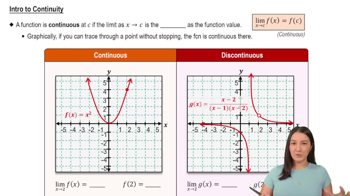
Intro to Continuity