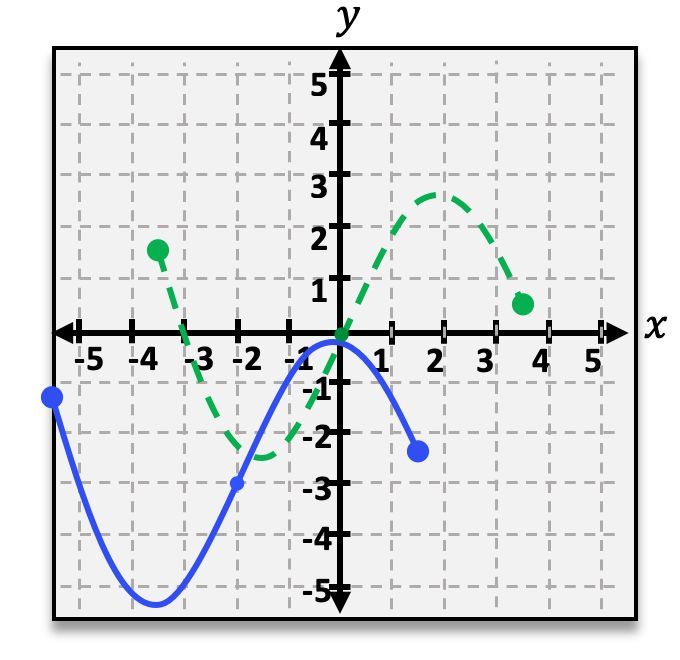
The green dotted line in the graph below represents the function f(x). The blue solid line represents the function g(x), which is the function f(x)after it has gone through a shift transformation. Find the equation for g(x).
A
g(x)=f(x−2)+3
B
g(x)=f(x−2)−3
C
g(x)=f(x+2)−3
D
g(x)=f(x)−3
0 댓글
검증된 단계별 안내
1
Identify the transformation from the graph: The green dotted line represents f(x), and the blue solid line represents g(x). Notice that the blue line is a horizontal shift to the left and a vertical shift downward from the green line.
Determine the horizontal shift: The graph of g(x) is shifted 2 units to the left compared to f(x). This means the transformation involves replacing x with (x + 2) in the function f(x).
Determine the vertical shift: The graph of g(x) is shifted 3 units downward compared to f(x). This means the transformation involves subtracting 3 from the function f(x).
Combine the transformations: The horizontal shift of 2 units to the left and the vertical shift of 3 units downward can be combined into the transformation g(x) = f(x + 2) - 3.
Verify the transformation: Check that the transformation g(x) = f(x + 2) - 3 correctly describes the shift observed in the graph, ensuring that the blue line is indeed the result of shifting the green line 2 units left and 3 units down.


 검증된 단계별 안내

