Skip to main content
College Algebra
나의 코스
배우기
시험 준비
AI 튜터
학습 가이드
교과서적 해결책
플래시카드
탐험해 보세요
앱을 사용해 보세요
나의 코스
배우기
시험 준비
AI 튜터
학습 가이드
교과서적 해결책
플래시카드
탐험해 보세요
앱을 사용해 보세요
뒤로
Graphing Polynomial Functions quiz
카드를 뒤집기 위해 탭할 수 있습니다.
What information do you need to start graphing a polynomial function?
카드를 뒤집기 위해 탭할 수 있습니다.
👆
What information do you need to start graphing a polynomial function?
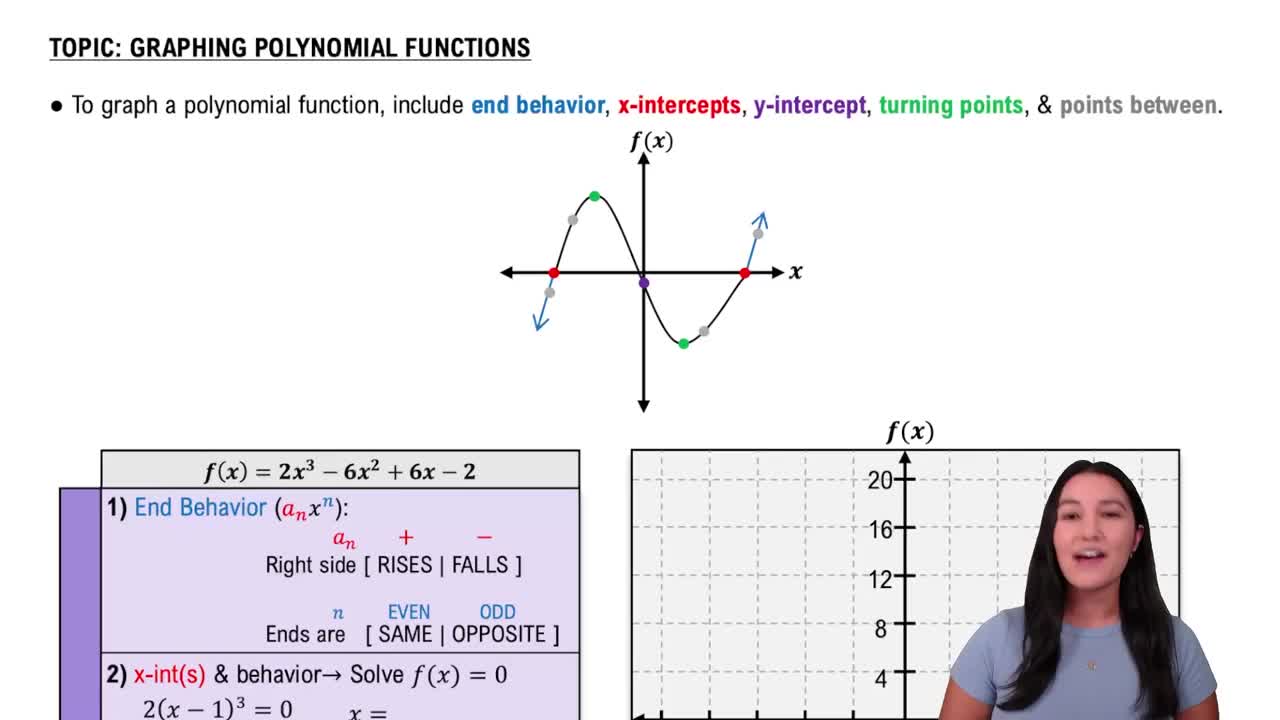
You need to identify known points such as x-intercepts, y-intercepts, and turning points, as well as determine the end behavior.
진행 상황 추적
컨트롤 버튼이 '내비게이션' 모드로 변경되었습니다.
1/15
관련 플래시카드
관련 실천
추천 영상
Graphing Polynomial Functions definitions
Graphing Polynomial Functions
15 용어
Graphing Polynomial Functions
4. Polynomial Functions
6 문제점
주제
Justin
Dividing Polynomials
4. Polynomial Functions
4 문제점
주제
Callie
4. Polynomial Functions
5 주제
11 문제점
장
Callie
09:43
Example 1
1755
views
26
rank
05:01
Identifying Intervals of Unknown Behavior
2615
views
43
rank
1
comments
05:25
Graphing Polynomial Functions
2003
views
31
rank
이 집합의 용어 (15)
하이드의 정의
What information do you need to start graphing a polynomial function?
You need to identify known points such as x-intercepts, y-intercepts, and turning points, as well as determine the end behavior.
How do you determine the end behavior of a polynomial function?
The end behavior is determined by the leading coefficient and the degree of the polynomial.
What is the process for finding x-intercepts of a polynomial function?
Set the polynomial equal to zero and solve for x to find the x-intercepts.
How do you find the y-intercept of a polynomial function?
Evaluate the polynomial at x = 0 to find the y-intercept.
What does the multiplicity of an x-intercept tell you about the graph at that point?
Multiplicity tells you whether the graph crosses the x-axis (odd multiplicity) or touches and turns around (even multiplicity).
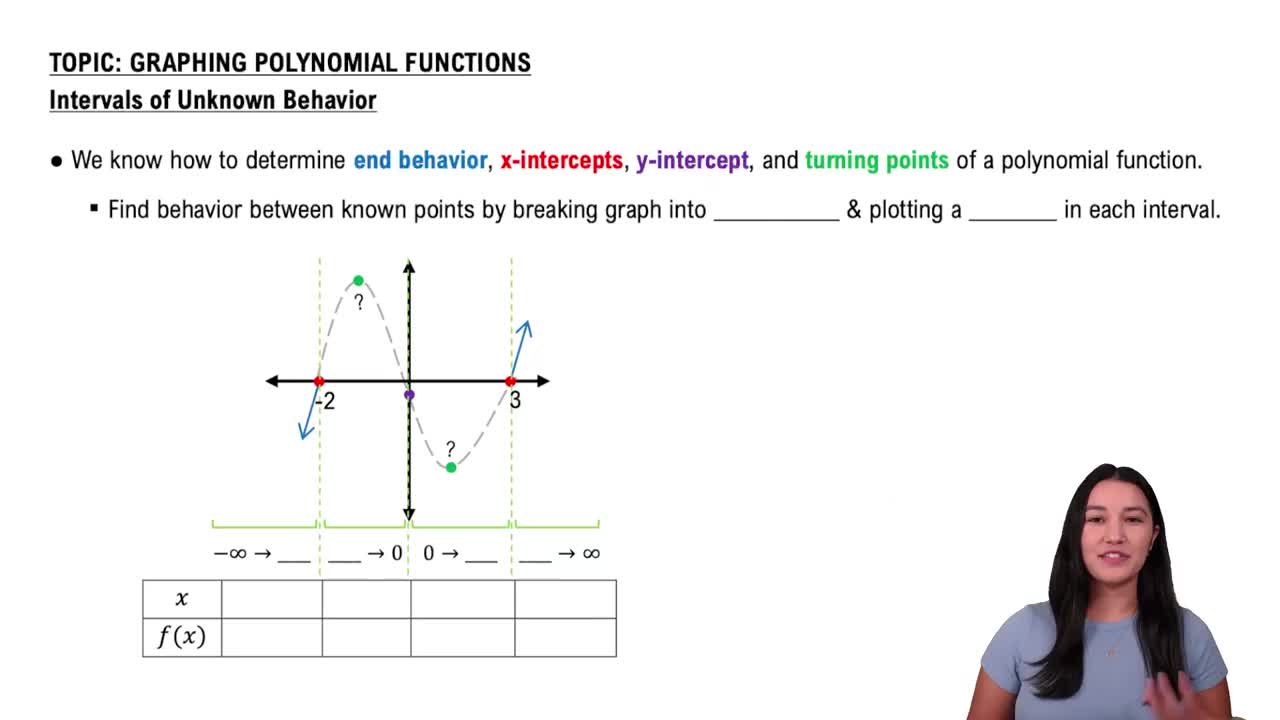
How can you fill in unknown intervals on the graph of a polynomial function?
Select x-values within the unknown intervals, calculate their f(x) values, and plot these points to clarify the graph's shape.
What is the maximum number of turning points a polynomial function can have?
The maximum number of turning points is the degree of the polynomial minus one.
Why is it important to plot points in unknown intervals when graphing a polynomial?
Plotting points in unknown intervals helps reveal the graph's behavior between known points, making the graph more accurate.
What should you do after plotting all known and calculated points on a polynomial graph?
Connect all points with a smooth, continuous curve to complete the graph.
How do you check if your polynomial graph is correct regarding turning points?
Verify that the number of turning points does not exceed the degree minus one.
What is the significance of the leading coefficient being positive in a cubic polynomial?
A positive leading coefficient means the graph rises on the right side as x approaches infinity.
How does the degree of a polynomial affect its end behavior?
An odd degree means the ends of the graph go in opposite directions; an even degree means both ends go the same way.
What is a good strategy for choosing x-values in unknown intervals?
Choose x-values that are easy to plot and provide useful information about the graph's shape.
What happens at an x-intercept with odd multiplicity?
The graph crosses the x-axis at that point.
What is the final step in graphing a polynomial function?
The final step is to check the number of turning points and ensure the graph matches the expected end behavior.
 뒤로뒤로
뒤로뒤로

 09:43
09:43