Skip to main content
College Algebra
나의 코스
배우기
시험 준비
AI 튜터
학습 가이드
교과서적 해결책
플래시카드
탐험해 보세요
앱을 사용해 보세요
나의 코스
배우기
시험 준비
AI 튜터
학습 가이드
교과서적 해결책
플래시카드
탐험해 보세요
앱을 사용해 보세요
뒤로
Graphing Rational Functions definitions
카드를 뒤집기 위해 탭할 수 있습니다.
Rational Function
카드를 뒤집기 위해 탭할 수 있습니다.
👆
Rational Function
An expression formed by dividing one polynomial by another, often exhibiting asymptotes and restricted domains.
진행 상황 추적
컨트롤 버튼이 '내비게이션' 모드로 변경되었습니다.
1/15
관련 플래시카드
관련 실천
추천 영상
Graphing Rational Functions quiz
Graphing Rational Functions
15 용어
Graphing Rational Functions
5. Rational Functions
5 문제점
주제
Justin
Asymptotes
5. Rational Functions
5 문제점
주제
Callie
5. Rational Functions
3 주제
7 문제점
장
Callie
5:31
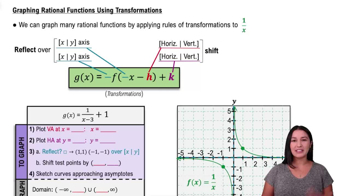
Graphing Rational Functions Using Transformations
2763
views
42
rank
1
comments
3:08
Example 1
1667
views
18
rank
10:18
Example 1
1372
views
20
rank
이 집합의 용어 (15)
하이드의 정의
Rational Function
An expression formed by dividing one polynomial by another, often exhibiting asymptotes and restricted domains.
Transformation
A change applied to a graph, such as shifting, reflecting, or stretching, altering its position or orientation.
Vertical Asymptote
A dashed line where the graph approaches but never touches, occurring where the denominator equals zero.
Horizontal Asymptote
A dashed line indicating the value a function approaches as x becomes very large or very small.
Reflection
A flip of the graph over the x-axis or y-axis, determined by a negative sign outside or inside the function.
Horizontal Shift
A movement of the graph left or right, determined by the value subtracted from x inside the function.
Vertical Shift
A movement of the graph up or down, determined by a constant added or subtracted outside the function.
Domain
All possible x-values for which the function is defined, often excluding values that make the denominator zero.
Range
All possible y-values the function can take, typically split by horizontal asymptotes.
X-intercept
A point where the graph crosses the x-axis, found by setting the numerator equal to zero.
Y-intercept
A point where the graph crosses the y-axis, found by evaluating the function at x equals zero.
Multiplicity
The number of times a factor appears in the numerator or denominator, affecting how the graph behaves at intercepts.
Interval
A section of the x-axis between key points like asymptotes or intercepts, used to analyze graph behavior.
Set Notation
A mathematical way to describe domain and range, often using symbols like parentheses and union.
Leading Coefficient
The coefficient of the highest degree term in a polynomial, used to determine horizontal asymptotes.
 뒤로뒤로
뒤로뒤로

 5:31
5:31