Skip to main content
College Algebra
나의 코스
배우기
시험 준비
AI 튜터
학습 가이드
교과서적 해결책
플래시카드
탐험해 보세요
앱을 사용해 보세요
나의 코스
배우기
시험 준비
AI 튜터
학습 가이드
교과서적 해결책
플래시카드
탐험해 보세요
앱을 사용해 보세요
뒤로
Two-Variable Equations quiz
1 학생이 이 점이 도움이 되었다고 느꼈습니다
카드를 뒤집기 위해 탭할 수 있습니다.
What is the main difference between equations with one variable and equations with two variables?
카드를 뒤집기 위해 탭할 수 있습니다.
👆
What is the main difference between equations with one variable and equations with two variables?
Equations with one variable have a single solution, while equations with two variables have infinitely many solutions represented as ordered pairs.
진행 상황 추적
컨트롤 버튼이 '내비게이션' 모드로 변경되었습니다.
1/15
관련 플래시카드
관련 실천
추천 영상
Two-Variable Equations definitions
Two-Variable Equations
15 용어
Two-Variable Equations
2. Graphs of Equations
5 문제점
주제
Callie
Lines
2. Graphs of Equations
7 문제점
주제
Callie
2. Graphs of Equations
3 주제
8 문제점
장
Callie
04:29
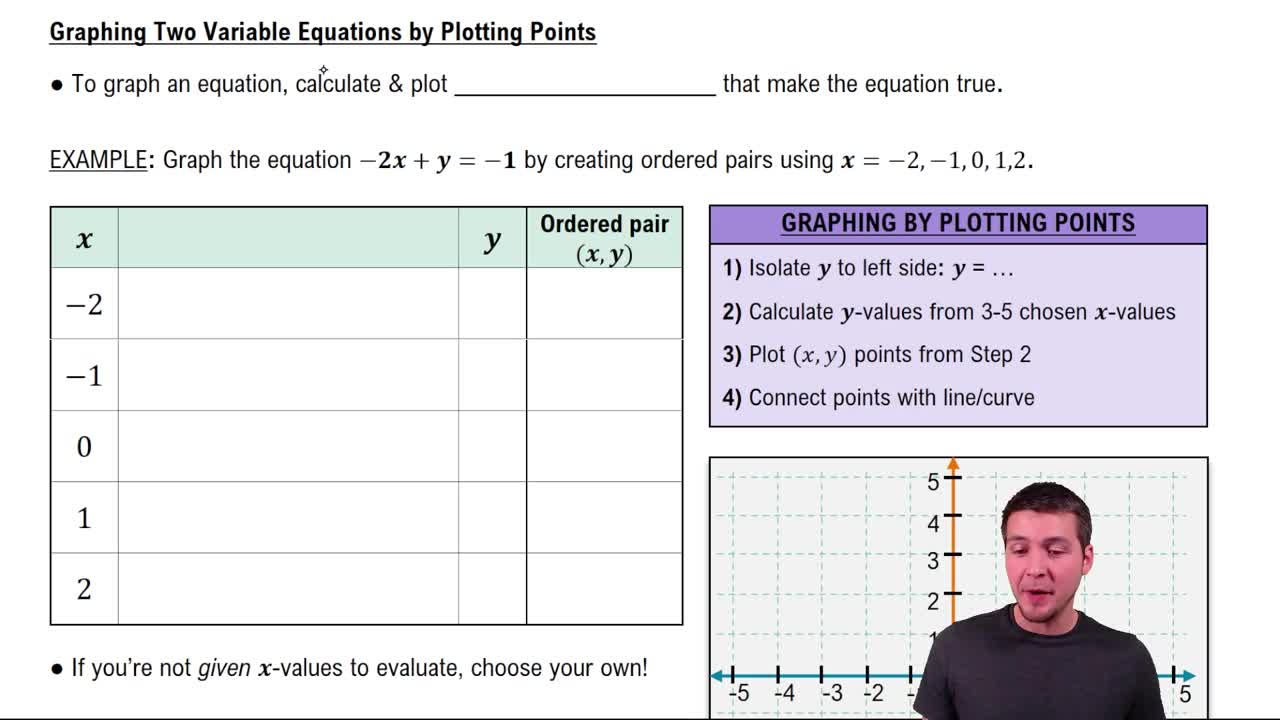
Graphing Equations of Two Variables by Plotting Points
2741
views
73
rank
1
comments
04:08
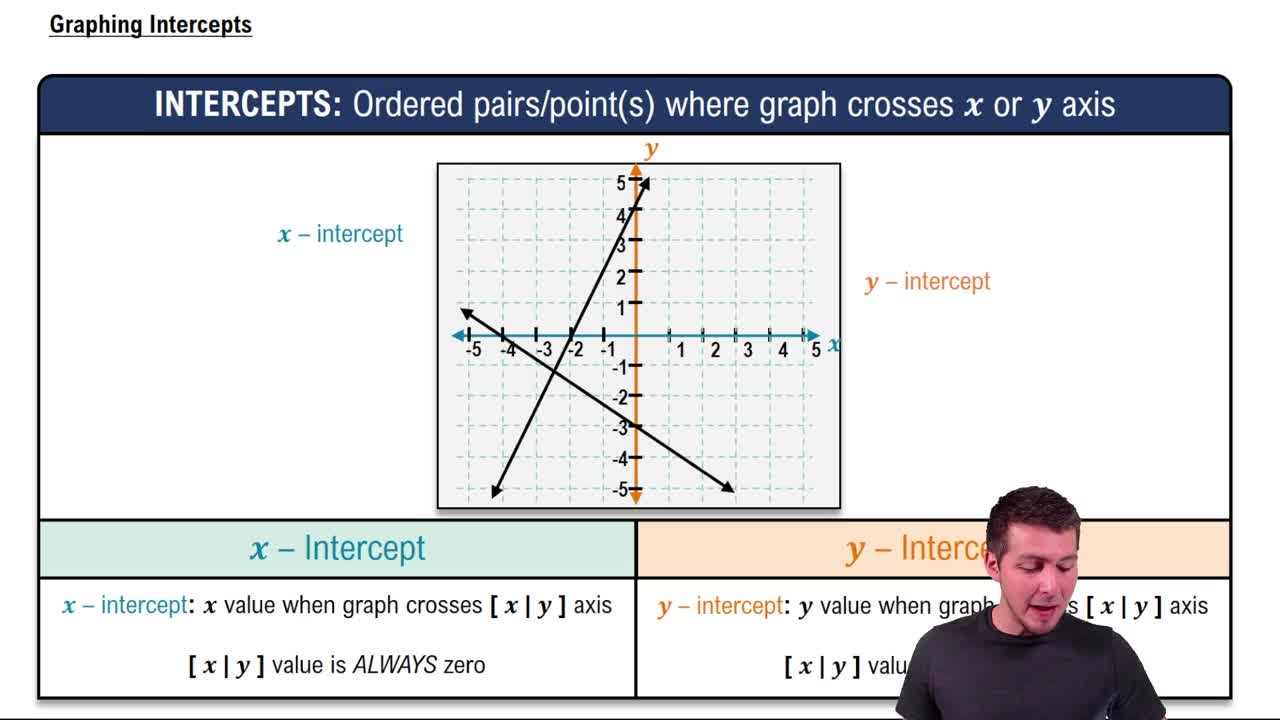
Graphing Intercepts
2310
views
77
rank
05:28
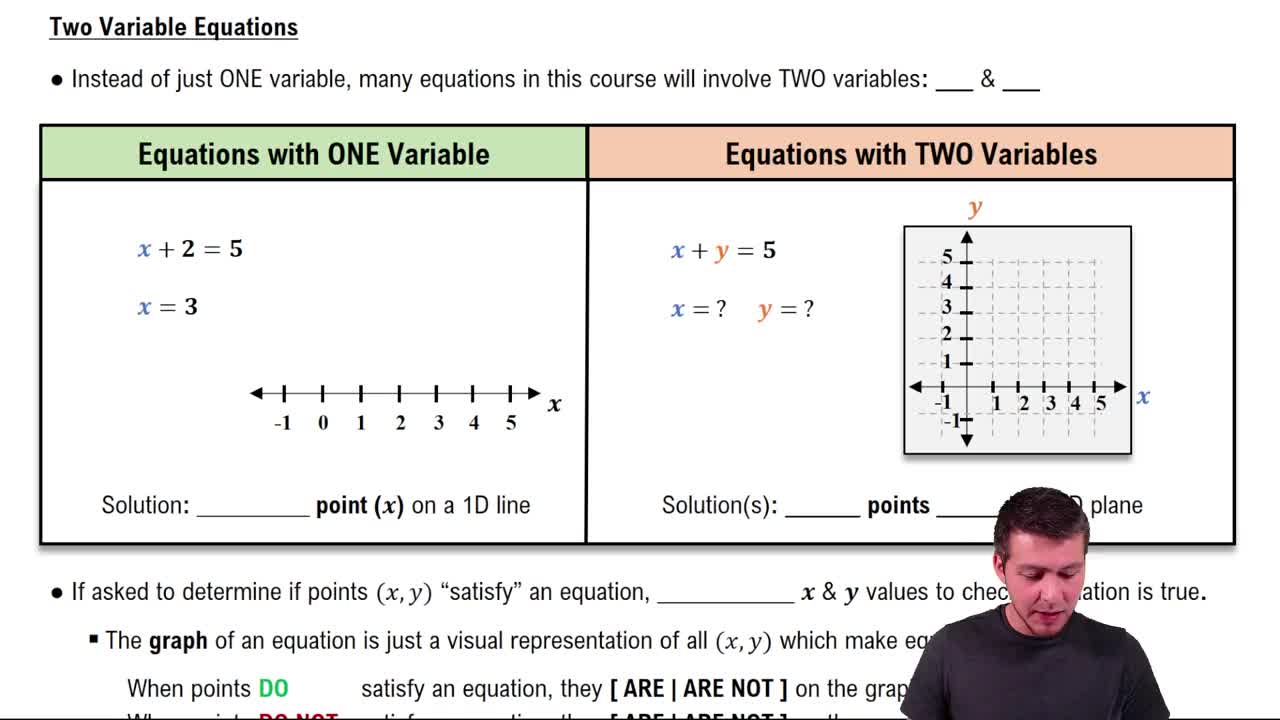
Equations with Two Variables
3757
views
94
rank
2
comments
이 집합의 용어 (15)
하이드의 정의
What is the main difference between equations with one variable and equations with two variables?
Equations with one variable have a single solution, while equations with two variables have infinitely many solutions represented as ordered pairs.
How do you determine if an ordered pair is a solution to a two-variable equation?
Substitute the x and y values from the ordered pair into the equation and check if the equation is true.
What does it mean for a point to satisfy a two-variable equation?
It means that when the point's x and y values are substituted into the equation, the equation holds true.
How are solutions to two-variable equations represented graphically?
They are represented as points (ordered pairs) on a two-dimensional plane.
What is the general process for graphing a two-variable equation like -2x + y = -1?
Isolate y, substitute various x values to find corresponding y values, plot the ordered pairs, and connect them with a line.
Why is it helpful to isolate y when graphing a two-variable equation?
Isolating y makes it easier to substitute x values and directly calculate the corresponding y values.
What is an x-intercept and how do you find it?
An x-intercept is where the graph crosses the x-axis, found by setting y = 0 and solving for x.
What is a y-intercept and how do you find it?
A y-intercept is where the graph crosses the y-axis, found by setting x = 0 and solving for y.
What is always true about the y value at an x-intercept?
The y value is always 0 at an x-intercept.
What is always true about the x value at a y-intercept?
The x value is always 0 at a y-intercept.
If you are asked for the x-intercepts of a graph, what should you provide?
You should provide the x values where the graph crosses the x-axis.
If you are asked for the intercepts of a graph (without specifying x or y), what should you provide?
You should provide the ordered pairs where the graph crosses the axes.
How many ordered pairs do you typically need to plot to graph a straight line from a two-variable equation?
Usually, 3 to 5 ordered pairs are enough to graph a straight line.
What happens to the graph of a two-variable equation if you plot all points that satisfy the equation?
You get a straight line (for linear equations) that passes through all those points.
What does it mean if a point does not lie on the graph of a two-variable equation?
It means the point does not satisfy the equation when its x and y values are substituted in.
 뒤로
뒤로
 04:29
04:29