
교과서 질문
If a number is decreased by 3, the principal square root of this difference is 5 less than the number. Find the number(s).
728
views

 검증된 단계별 안내
 05:18
05:18
 07:52
07:52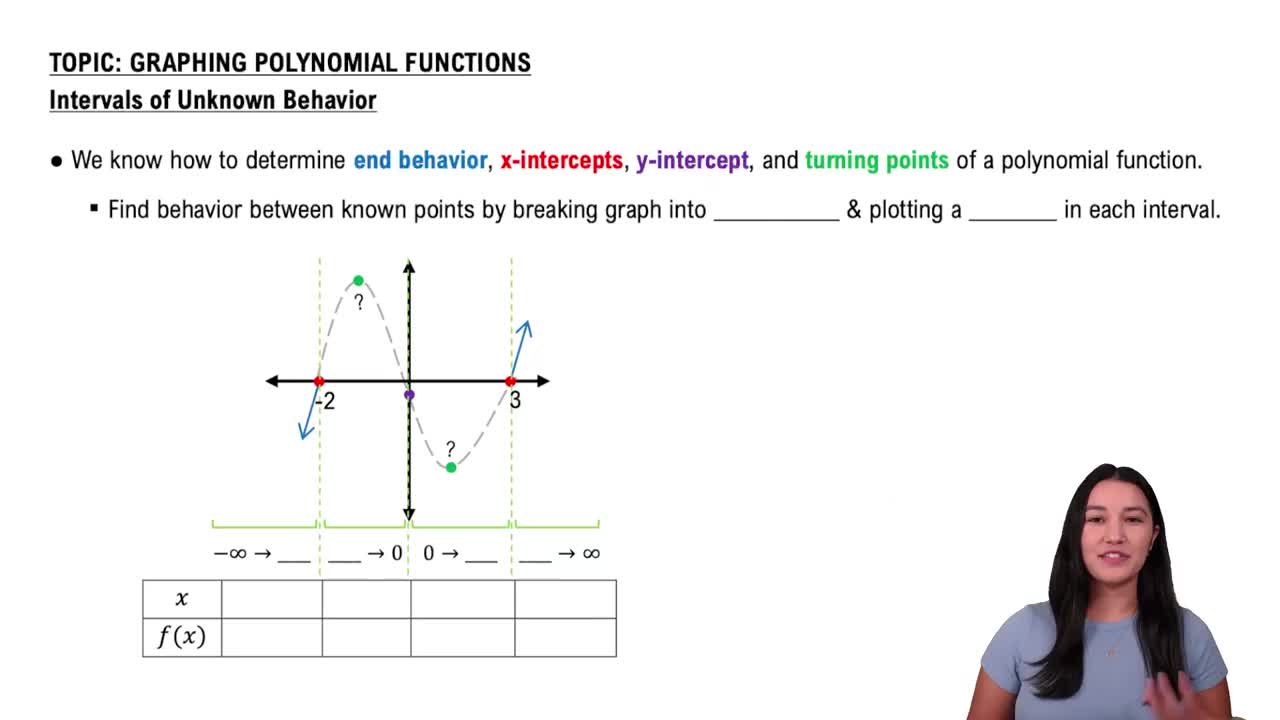 05:01
05:01If a number is decreased by 3, the principal square root of this difference is 5 less than the number. Find the number(s).
Solve each equation in Exercises 83–108 by the method of your choice. 3/(x - 3) + 5/(x - 4) = (x2 - 20)/(x2 - 7x + 12)
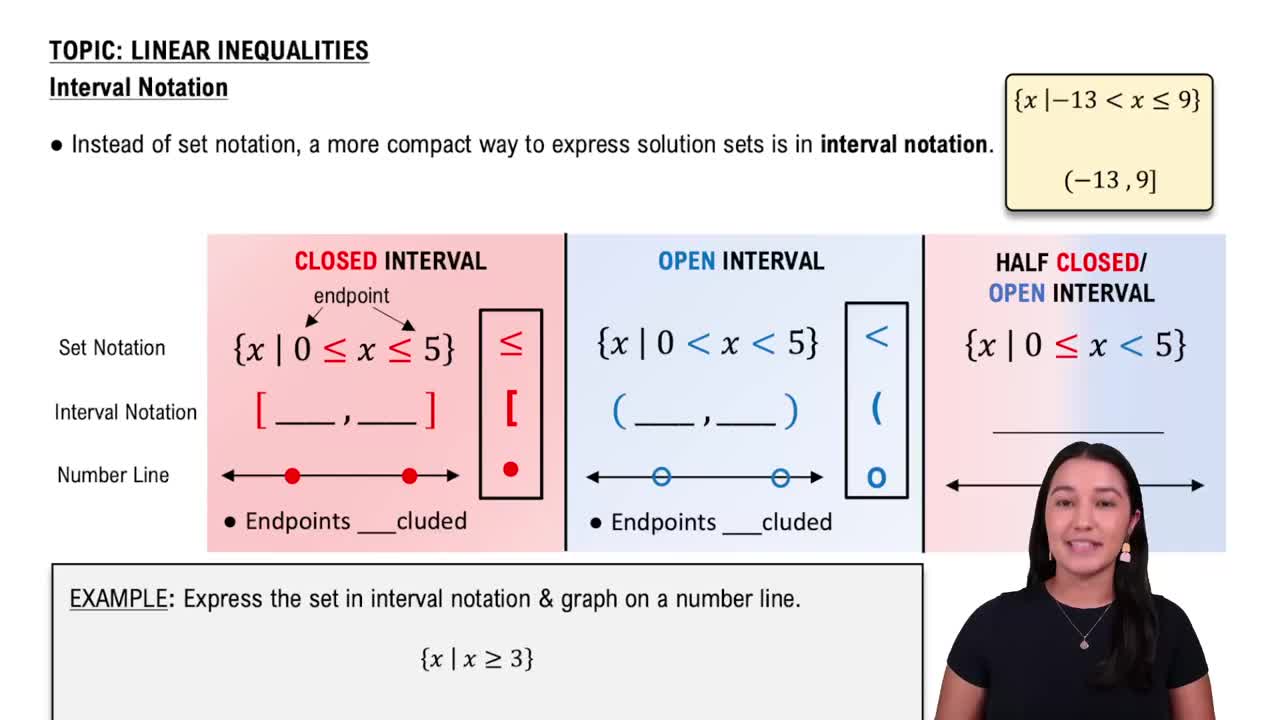
Solve and graph the solution set on a number line: (2x−3)/4 ≥ 3x/4 + 1/2
In Exercises 109–114, find the x-intercept(s) of the graph of each equation. Use the x-intercepts to match the equation with its graph. The graphs are shown in [- 10, 10, 1] by [- 10, 10, 1] viewing rectangles and labeled (a) through (f). y = x2 - 4x - 5
When 4 times a number is subtracted from 5, the absolute value of the difference is at most 13. Use interval notation to express the set of all numbers that satisfy this condition.
In Exercises 109–114, find the x-intercept(s) of the graph of each equation. Use the x-intercepts to match the equation with its graph. The graphs are shown in [- 10, 10, 1] by [- 10, 10, 1] viewing rectangles and labeled (a) through (f). y = - (x + 1)2 + 4