
교과서 질문
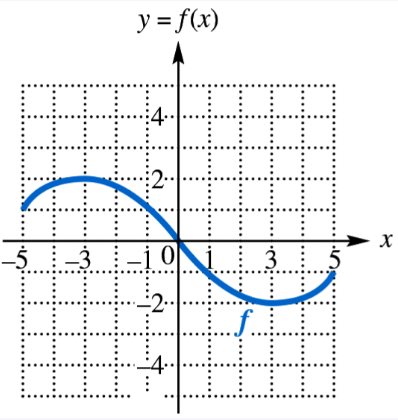
Each of the following graphs is obtained from the graph of ƒ(x)=|x| or g(x)=√x by applying several of the transformations discussed in this section. Describe the transformations and give an equation for the graph.
1228
views

 검증된 단계별 안내
 02:44
02:44
 02:16
02:16 4:26
4:26Each of the following graphs is obtained from the graph of ƒ(x)=|x| or g(x)=√x by applying several of the transformations discussed in this section. Describe the transformations and give an equation for the graph.
Each of the following graphs is obtained from the graph of ƒ(x)=|x| or g(x)=√x by applying several of the transformations discussed in this section. Describe the transformations and give an equation for the graph.
Describe how the graph of each function can be obtained from the graph of ƒ(x) = |x|. g(x) = -|x|
Let ƒ(x) = 3x -4. Find an equation for each reflection of the graph of ƒ(x). across the y-axis
Let ƒ(x) = 3x -4. Find an equation for each reflection of the graph of ƒ(x). across the x-axis
Each of the following graphs is obtained from the graph of ƒ(x)=|x| or g(x)=√x by applying several of the transformations discussed in this section. Describe the transformations and give an equation for the graph.