Ch. 2 - Graphs and Functions
Lial - College Algebra 13th Edition
Lial13th EditionCollege AlgebraISBN: 9780136881063당신이 사용하는 게 아니라요?교과서 변경
3장, 문제 44

Graph each equation.
ƒ(x)=3ƒ(x) = 3

검증된 단계별 안내
1
Identify the type of function given. The function ƒ(x) = 3 is a constant function, meaning it outputs the same value regardless of the input x.
Understand that the graph of a constant function is a horizontal line because the output value does not change as x changes.
Write the equation of the horizontal line, which is simply y = 3, since ƒ(x) = 3 means the output y is always 3.
To graph the function, plot several points where the y-coordinate is 3 for different values of x, such as (0, 3), (1, 3), (-1, 3), etc.
Draw a straight horizontal line through all these points, extending infinitely in both directions along the x-axis.

비슷한 문제에 대한 검증된 영상 답변:

이 영상 해법은 위 문제에 도움이 된다고 튜터들이 추천한 것입니다.
영상 길이:
53s
도움이 되었나요?

주요 개념

질문에 올바르게 답하기 위해 반드시 이해해야 하는 핵심 개념들은 다음과 같습니다.

Constant Functions

A constant function is a function where the output value is the same for every input. In this case, ƒ(x) = 3 means the function always outputs 3 regardless of x. Its graph is a horizontal line crossing the y-axis at 3.
추천 영상:
6:13
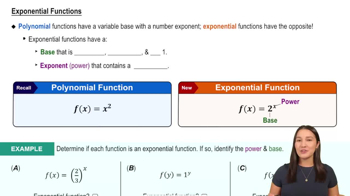
Exponential Functions

Graphing Horizontal Lines

Horizontal lines on the coordinate plane have the form y = c, where c is a constant. They run parallel to the x-axis and indicate that the y-value does not change as x varies. For ƒ(x) = 3, the line is horizontal at y = 3.
추천 영상:
가이드 코스
02:35
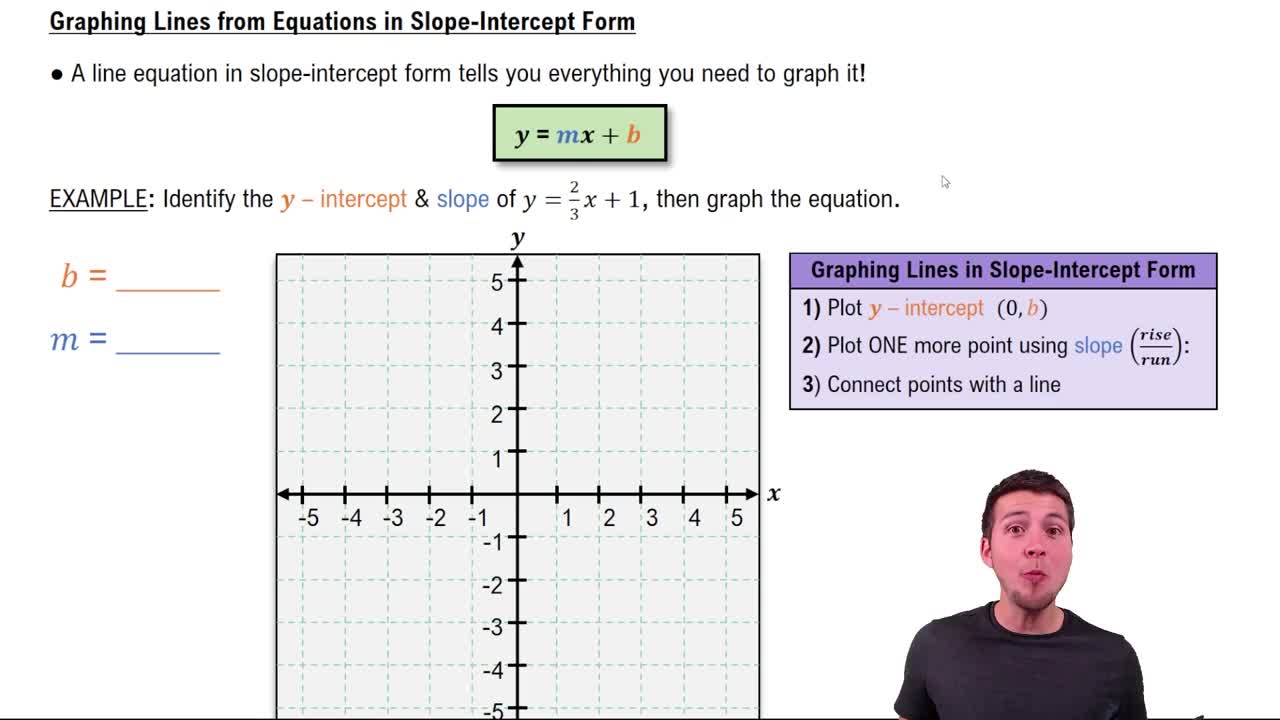
Graphing Lines in Slope-Intercept Form

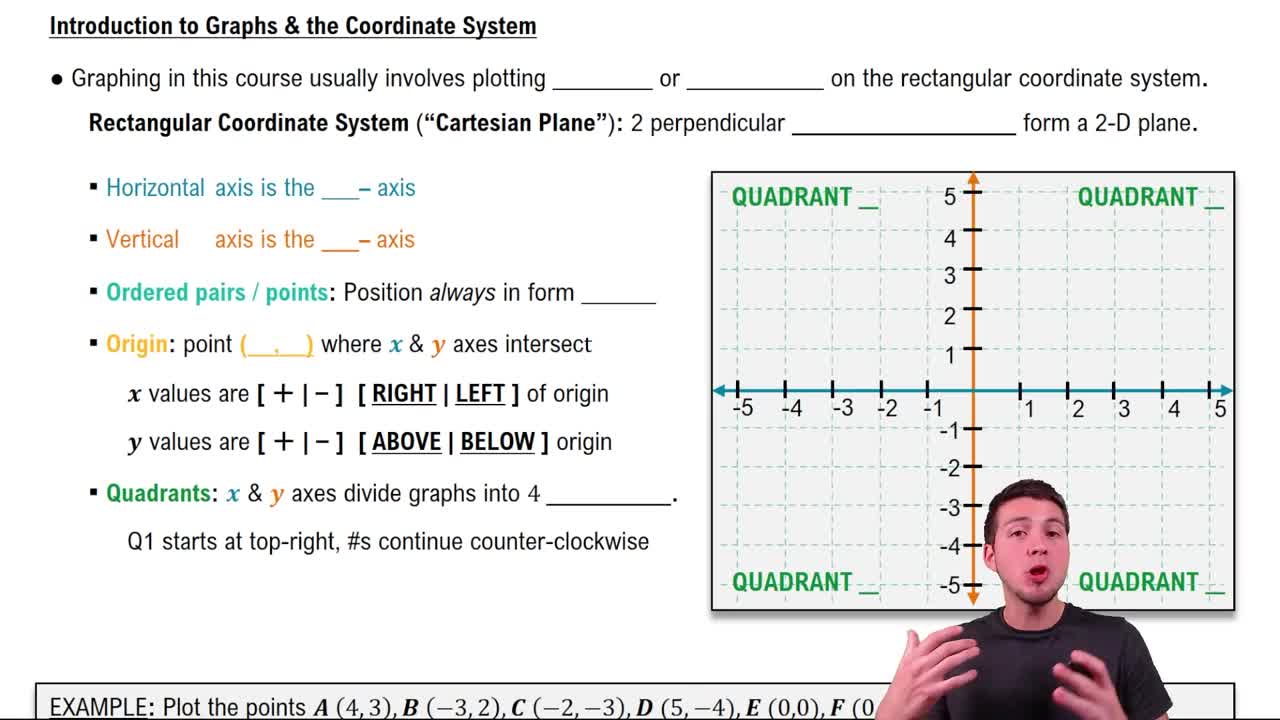
Coordinate Plane and Plotting Points

The coordinate plane consists of an x-axis and y-axis used to plot points (x, y). To graph ƒ(x) = 3, plot multiple points where y is always 3, such as (0,3), (1,3), and (-2,3), then connect them to form the horizontal line.
추천 영상:
가이드 코스
05:10
Graphs & the Rectangular Coordinate System