Ch. 2 - Graphs and Functions
Lial - College Algebra 13th Edition
Lial13th EditionCollege AlgebraISBN: 9780136881063당신이 사용하는 게 아니라요?교과서 변경
3장, 문제 68

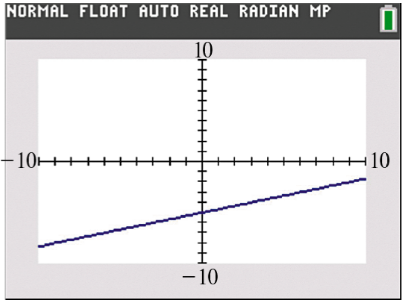
Solve each problem. A graph of y=ƒ(x) is shown in the standard viewing window. Which is the only value of x that could possibly be the solution of the equation ƒ(x) =0? A. -15 B. 0 C. 5 D. 15
Graph of a line in a standard window with x and y axes from -10 to 10, showing a positive slope.

검증된 단계별 안내
1
Step 1: Understand that the equation ƒ(x) = 0 means we are looking for the x-value(s) where the graph of the function crosses the x-axis (where y = 0).
Step 2: Observe the graph of y = g(x) and identify where the red line intersects the x-axis. This is the point where the function value is zero.
Step 3: Note the x-coordinate of the point where the line crosses the x-axis. This x-value is the solution to the equation ƒ(x) = 0.
Step 4: Compare the x-coordinate of the intersection point with the given options: -15, 0, 5, and 15.
Step 5: Select the option that matches the x-coordinate of the intersection point on the graph, as this is the only possible solution to ƒ(x) = 0.

비슷한 문제에 대한 검증된 영상 답변:

이 영상 해법은 위 문제에 도움이 된다고 튜터들이 추천한 것입니다.
영상 길이:
4m
도움이 되었나요?

주요 개념

질문에 올바르게 답하기 위해 반드시 이해해야 하는 핵심 개념들은 다음과 같습니다.

Zero of a Function

A zero of a function is a value of x for which the function's output y equals zero. Graphically, this corresponds to the point(s) where the graph intersects the x-axis. Identifying zeros helps solve equations of the form f(x) = 0.
추천 영상:
03:42
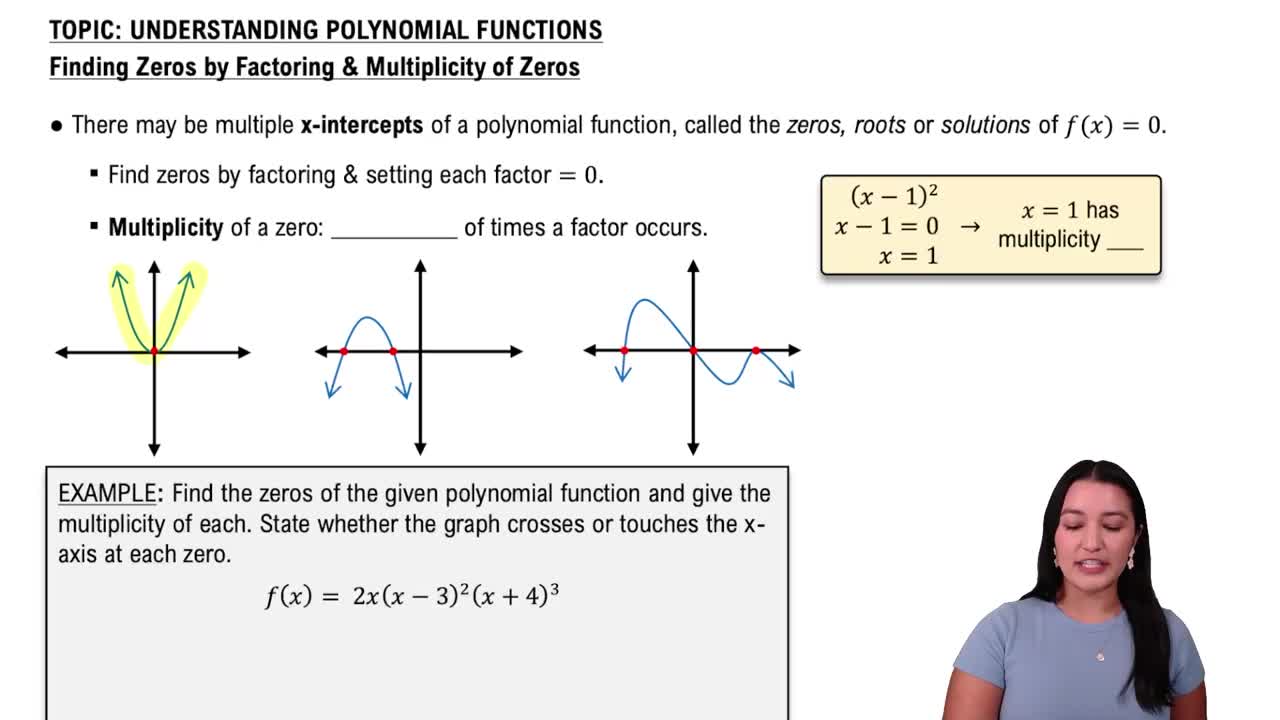
Finding Zeros & Their Multiplicity

Interpreting Graphs

Interpreting graphs involves understanding the relationship between x and y values visually. For a function graph, the x-values where the curve crosses the x-axis indicate solutions to f(x) = 0. Careful observation of the graph's scale and intercepts is essential.
추천 영상:
02:16
Graphs and Coordinates - Example

Linear Functions and Their Graphs

A linear function has the form y = mx + b, producing a straight line graph. The slope m indicates the line's steepness and direction. The x-intercept, where y=0, can be found by solving mx + b = 0, representing the function's zero.
추천 영상:
5:26
Graphs of Logarithmic Functions