Ch. 2 - Graphs and Functions
Lial - College Algebra 13th Edition
Lial13th EditionCollege AlgebraISBN: 9780136881063당신이 사용하는 게 아니라요?교과서 변경
3장, 문제 37

Use a graphing calculator to graph each equation in the standard viewing window. 3x + 4y = 6

검증된 단계별 안내
1
Rewrite the given equation \(3x + 4y = 6\) in slope-intercept form \(y = mx + b\) by isolating \(y\). Start by subtracting \(3x\) from both sides: \(4y = -3x + 6\).
Next, divide every term by 4 to solve for \(y\): \(y = \frac{-3}{4}x + \frac{6}{4}\). Simplify the fraction \(\frac{6}{4}\) if possible.
Turn on your graphing calculator and enter the function \(y = -\frac{3}{4}x + \frac{3}{2}\) into the function input (usually labeled as \(Y=\)).
Set the graphing window to the standard viewing window, which typically has \(x\) and \(y\) values ranging from -10 to 10. This ensures you see the main features of the graph.
Graph the equation and observe the line. Note the slope \(-\frac{3}{4}\) which indicates the line falls 3 units vertically for every 4 units it moves horizontally, and the y-intercept \(\frac{3}{2}\) where the line crosses the y-axis.

비슷한 문제에 대한 검증된 영상 답변:

이 영상 해법은 위 문제에 도움이 된다고 튜터들이 추천한 것입니다.
영상 길이:
2m
도움이 되었나요?

주요 개념

질문에 올바르게 답하기 위해 반드시 이해해야 하는 핵심 개념들은 다음과 같습니다.

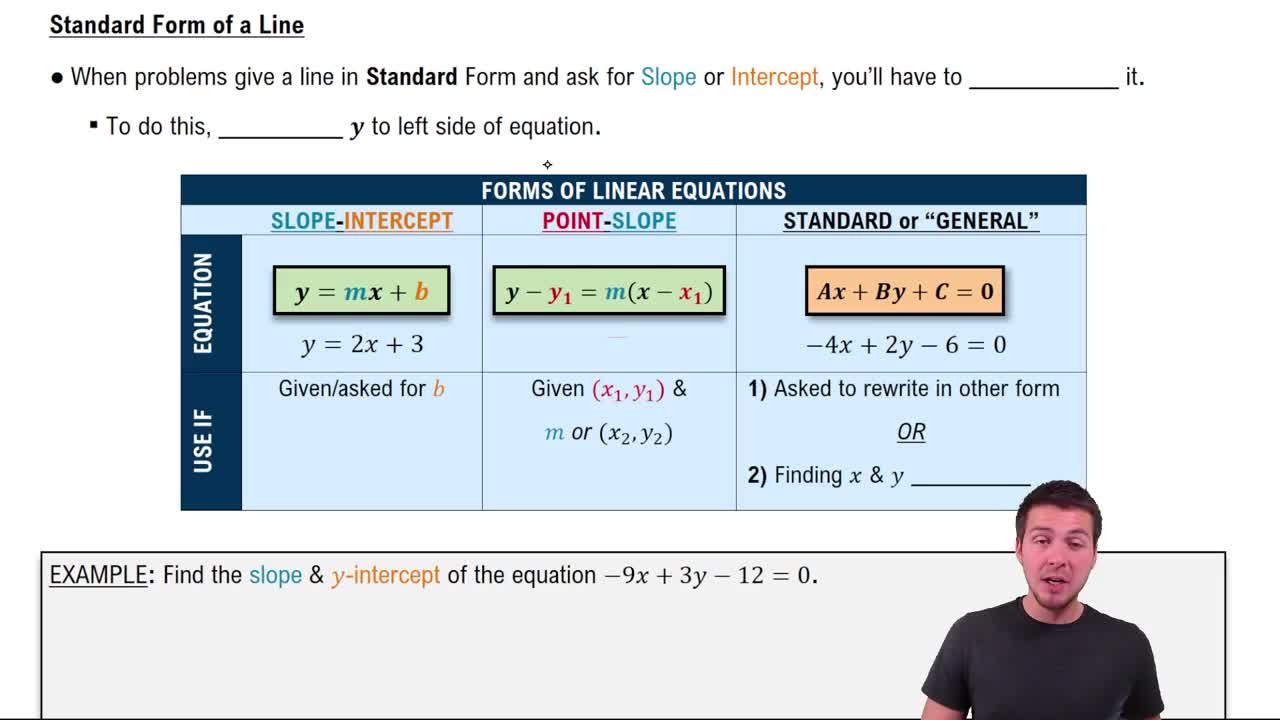
Standard Form of a Linear Equation

The standard form of a linear equation is written as Ax + By = C, where A, B, and C are constants. Understanding this form helps in identifying the coefficients and constants needed to graph the line or convert it into slope-intercept form for easier plotting.
추천 영상:
가이드 코스
05:39
Standard Form of Line Equations

Graphing Linear Equations Using a Calculator

Graphing calculators allow you to input equations and visualize their graphs quickly. For linear equations, you often need to solve for y or use the calculator’s function input to plot the line within the standard viewing window, typically set from -10 to 10 on both axes.
추천 영상:
06:00
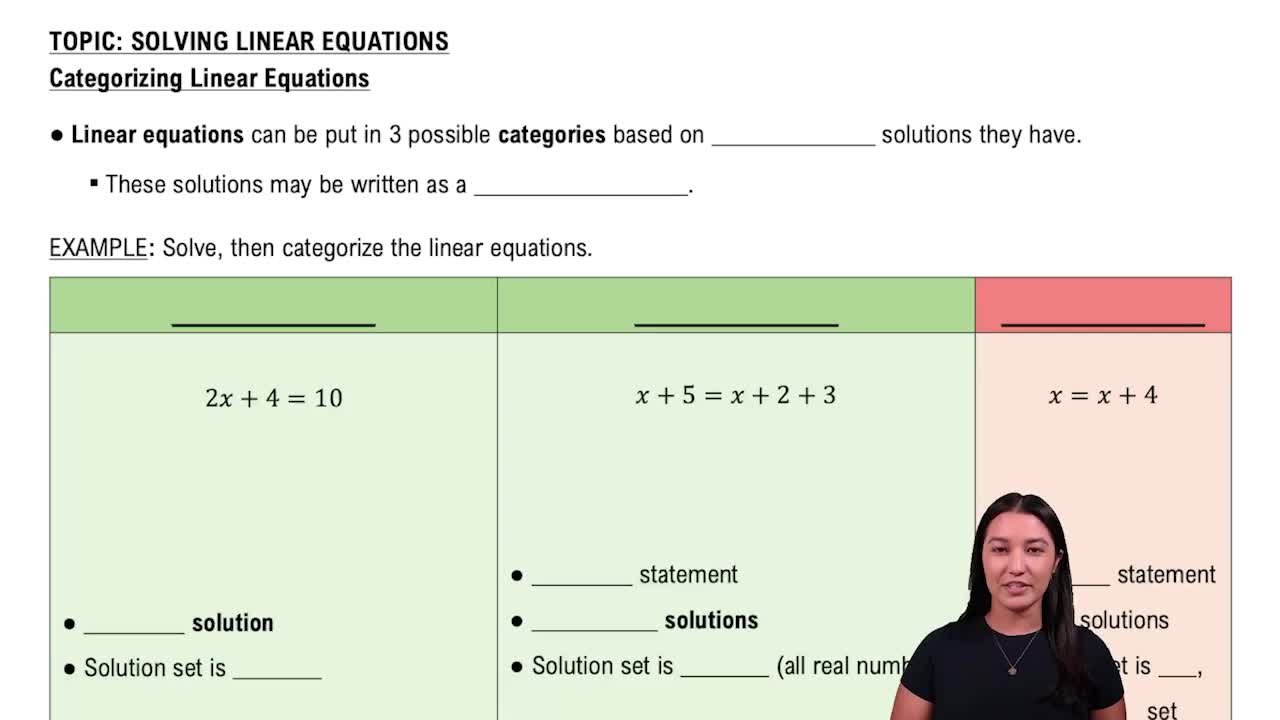
Categorizing Linear Equations

Standard Viewing Window

The standard viewing window on a graphing calculator usually ranges from -10 to 10 on both the x- and y-axes. Knowing this helps you anticipate how the graph will appear and ensures the important features of the line, such as intercepts, are visible within this range.
추천 영상:
가이드 코스
05:16
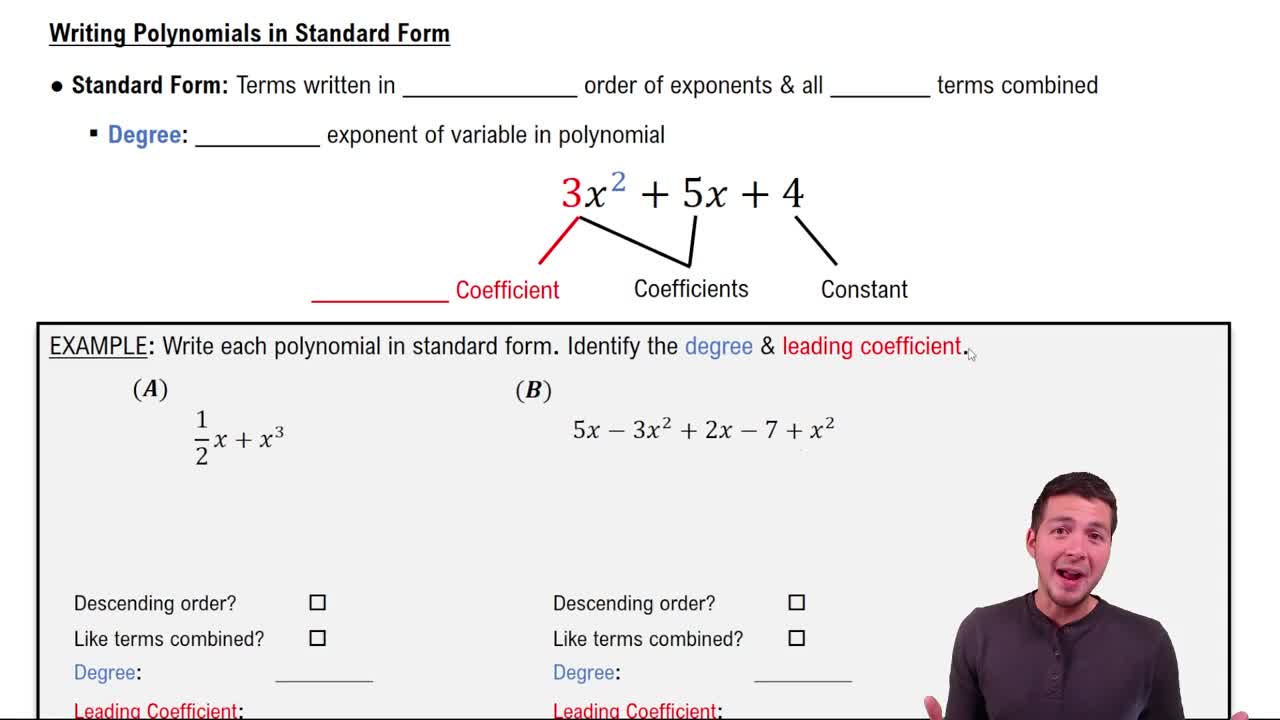
Standard Form of Polynomials