Ch. 3 - Polynomial and Rational Functions
Lial - College Algebra 13th Edition
Lial13th EditionCollege AlgebraISBN: 9780136881063당신이 사용하는 게 아니라요?교과서 변경
4장, 문제 85

Graph each rational function. ƒ(x)=(20+6x-2x2)/(8+6x-2x2)

검증된 단계별 안내
1
Identify the rational function given: \(f(x) = \frac{20 + 6x - 2x^2}{8 + 6x - 2x^2}\).
Rewrite the numerator and denominator in standard polynomial form by ordering terms from highest to lowest degree: numerator as \(-2x^2 + 6x + 20\) and denominator as \(-2x^2 + 6x + 8\).
Find the domain by determining where the denominator is zero. Solve the equation \(-2x^2 + 6x + 8 = 0\) to find values of \(x\) that are excluded from the domain.
Find the intercepts: For the y-intercept, evaluate \(f(0)\) by substituting \(x=0\) into the function. For x-intercepts, set the numerator equal to zero and solve \(-2x^2 + 6x + 20 = 0\).
Analyze the end behavior by comparing the degrees and leading coefficients of numerator and denominator to find the horizontal or oblique asymptotes. Since degrees are equal, the horizontal asymptote is the ratio of leading coefficients.

비슷한 문제에 대한 검증된 영상 답변:

이 영상 해법은 위 문제에 도움이 된다고 튜터들이 추천한 것입니다.
영상 길이:
9m
도움이 되었나요?

주요 개념

질문에 올바르게 답하기 위해 반드시 이해해야 하는 핵심 개념들은 다음과 같습니다.

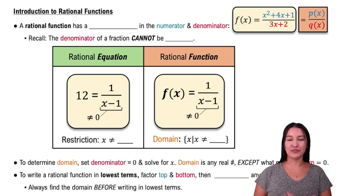
Rational Functions

A rational function is a ratio of two polynomials, expressed as f(x) = P(x)/Q(x). Understanding its domain, zeros, and behavior depends on analyzing both numerator and denominator polynomials. Key features include vertical asymptotes where the denominator is zero and holes where numerator and denominator share factors.
추천 영상:
6:04
Intro to Rational Functions

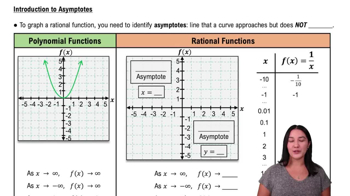
Asymptotes of Rational Functions

Asymptotes describe the behavior of a rational function as x approaches certain values. Vertical asymptotes occur where the denominator is zero and the numerator is nonzero. Horizontal or oblique asymptotes describe end behavior, determined by comparing degrees of numerator and denominator polynomials.
추천 영상:
6:24
Introduction to Asymptotes

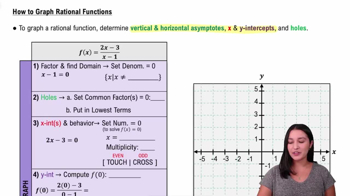
Graphing Techniques for Rational Functions

Graphing involves finding intercepts, asymptotes, and analyzing end behavior. Plot points around vertical asymptotes to understand function behavior near undefined values. Use intercepts and asymptotes to sketch the curve accurately, noting any holes or discontinuities.
추천 영상:
8:19
How to Graph Rational Functions