Ch. 5 - Systems and Matrices
Lial - College Algebra 13th Edition
Lial13th EditionCollege AlgebraISBN: 9780136881063당신이 사용하는 게 아니라요?교과서 변경
6장, 문제 23

Graph each inequality. y > (x - 1)2 + 2

검증된 단계별 안내
1
Identify the boundary curve by rewriting the inequality as an equation: \(y = (x - 1)^{2} + 2\). This is a parabola opening upwards with vertex at \((1, 2)\).
Graph the parabola \(y = (x - 1)^{2} + 2\) on the coordinate plane. Since the inequality is strict (\(>\)), draw the parabola as a dashed curve to indicate points on the curve are not included.
Determine which side of the parabola to shade by testing a point not on the curve, such as the point \((1, 3)\). Substitute into the inequality: \(3 > (1 - 1)^{2} + 2\) simplifies to \(3 > 2\), which is true.
Since the test point satisfies the inequality, shade the region above the parabola where \(y\) values are greater than \((x - 1)^{2} + 2\).
Label the graph clearly, showing the dashed parabola and the shaded region above it to represent all solutions to the inequality \(y > (x - 1)^{2} + 2\).

비슷한 문제에 대한 검증된 영상 답변:

이 영상 해법은 위 문제에 도움이 된다고 튜터들이 추천한 것입니다.
영상 길이:
9m
도움이 되었나요?

주요 개념

질문에 올바르게 답하기 위해 반드시 이해해야 하는 핵심 개념들은 다음과 같습니다.

Graphing Quadratic Functions

A quadratic function is represented by an equation of the form y = ax² + bx + c, producing a parabola when graphed. Understanding the shape and vertex of the parabola y = (x - 1)² + 2 helps in visualizing the boundary curve for the inequality.
추천 영상:
5:26
Graphs of Logarithmic Functions

Inequalities and Their Graphs

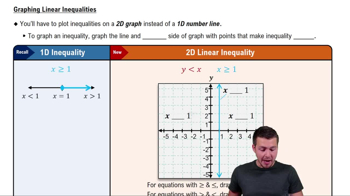
Graphing inequalities involves shading the region of the coordinate plane where the inequality holds true. For y > (x - 1)² + 2, the area above the parabola is shaded, indicating all points where y-values are greater than the quadratic expression.
추천 영상:
가이드 코스
7:02
Linear Inequalities

Boundary Lines and Open/Closed Curves

The boundary of the inequality y > (x - 1)² + 2 is the parabola y = (x - 1)² + 2. Since the inequality is strict (greater than, not greater than or equal to), the boundary curve is drawn as a dashed line to show points on the curve are not included in the solution.
추천 영상:
가이드 코스
06:49
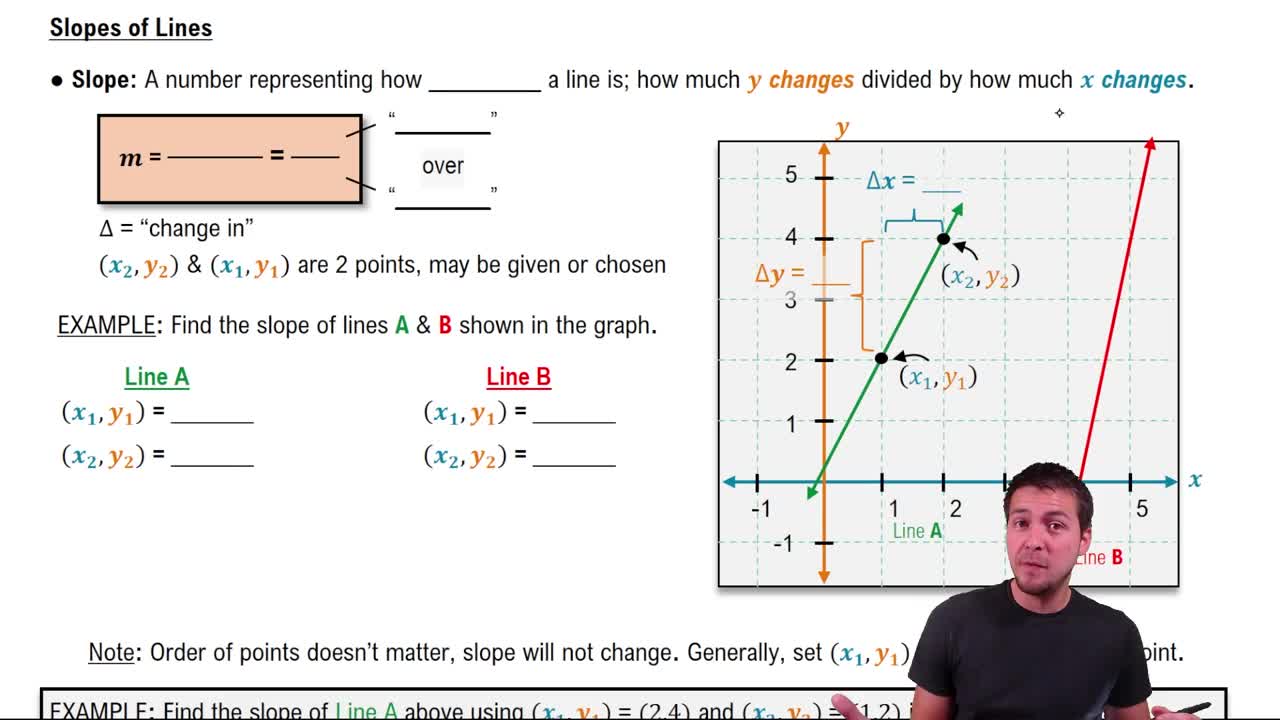
The Slope of a Line