Answer each question. A line passes through the points of intersection of the graphs of y = x2 and x2 + y2 = 90. What is the equation of this line?
Ch. 5 - Systems and Matrices

6장, 문제 64
Graph the solution set of each system of inequalities.
검증된 단계별 안내1
Step 1: Identify the inequalities in the system. The system consists of two inequalities: \( y \geq 3^x \) and \( y \geq 2 \).
Step 2: Graph the first inequality \( y \geq 3^x \). Start by graphing the boundary line \( y = 3^x \), which is an exponential function. Plot points for several values of \( x \) to get the shape of the curve, such as \( (0, 1), (1, 3), (2, 9) \), and so on. Since the inequality is \( \geq \), shade the region above the curve.
Step 3: Graph the second inequality \( y \geq 2 \). This is a horizontal line at \( y = 2 \). Since the inequality is \( \geq \), shade the region above this line.
Step 4: Determine the solution set by finding the intersection of the shaded regions from both inequalities. The solution set is where the shaded region from \( y \geq 3^x \) overlaps with the shaded region from \( y \geq 2 \).
Step 5: Clearly mark the solution set on the graph. This is the region that satisfies both inequalities, and it will be the area above both the curve \( y = 3^x \) and the line \( y = 2 \).

비슷한 문제에 대한 검증된 영상 답변:
이 영상 해법은 위 문제에 도움이 된다고 튜터들이 추천한 것입니다.
영상 길이:
6m도움이 되었나요?
주요 개념
질문에 올바르게 답하기 위해 반드시 이해해야 하는 핵심 개념들은 다음과 같습니다.
Inequalities
Inequalities are mathematical expressions that show the relationship between two values when they are not equal. They use symbols such as '≥' (greater than or equal to) and '≤' (less than or equal to) to indicate the range of possible solutions. Understanding how to interpret and graph inequalities is crucial for visualizing solution sets in coordinate systems.
추천 영상:
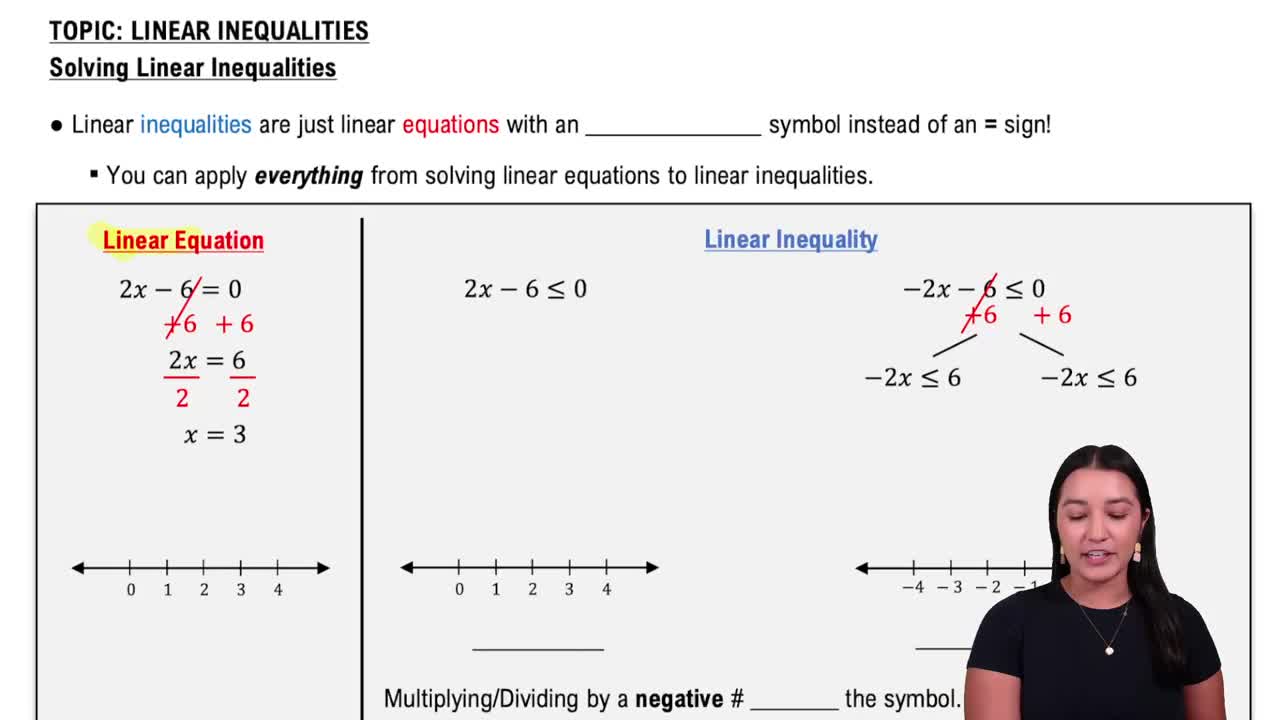
Linear Inequalities
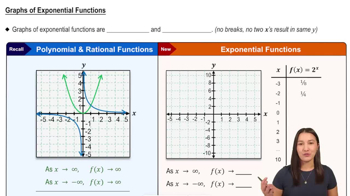
Graphing Exponential Functions
Exponential functions, such as y = 3^x, represent growth or decay processes and are characterized by a constant base raised to a variable exponent. When graphing these functions, it is important to recognize their shape, which typically includes a horizontal asymptote and increases rapidly for positive x-values. This understanding helps in determining the region of the graph that satisfies the inequality.
추천 영상:
Graphs of Exponential Functions
Shading Regions in Graphs
When graphing inequalities, shading is used to represent the solution set. For a given inequality, the area above (or below) the line is shaded to indicate all the points that satisfy the inequality. Knowing how to correctly shade the regions based on the inequality symbols is essential for accurately depicting the solution set on a graph.
추천 영상:
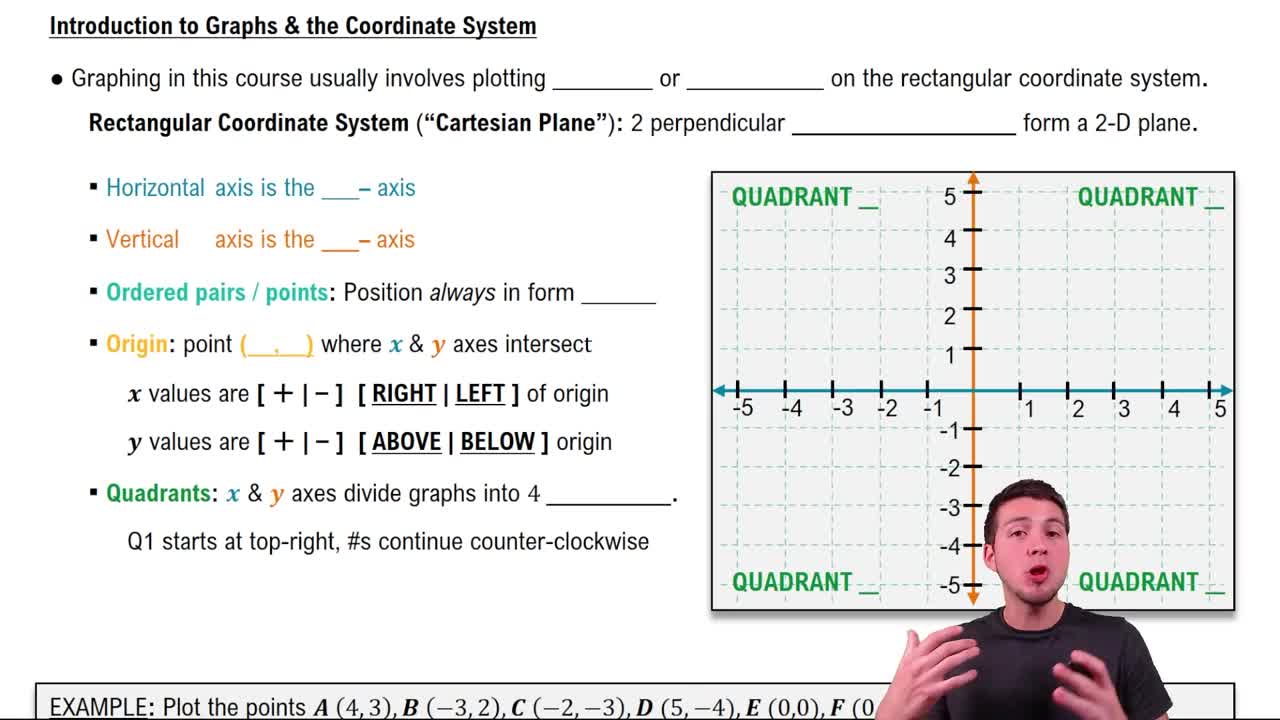
Graphs & the Rectangular Coordinate System
관련 실천
교과서 질문
493
views
교과서 질문
Use Cramer's rule to solve each system of equations. If D = 0, then use another method to determine the solution set. See Examples 5–7.
4x + 3y = -7
2x + 3y = -11
618
views
교과서 질문
Answer each question. Does the straight line 3x - 2y = 9 intersect the circle x2 + y2 = 25? (Hint: To find out, solve the system formed by these two equations.)
495
views
교과서 질문
Use Cramer's rule to solve each system of equations. If D = 0, then use another method to determine the solution set. See Examples 5–7.
x + y = 4
2x - y = 2
919
views
교과서 질문
Solve each problem. Find the equation of the line passing through the points of intersection of the graphs of x2 + y2 = 20 and x2 - y = 0.
539
views
교과서 질문
Find each product, if possible. See Examples 5–7. <4x2 Matrix>
783
views