Ch.15 - Chemical Equilibrium
Brown - Chemistry: The Central Science 14th Edition
Brown14th EditionChemistry: The Central ScienceISBN: 9780134414232당신이 사용하는 게 아니라요?교과서 변경
15장, 문제 98e

The phase diagram for SO2 is shown here. (e) At which of the three red points does SO2(g) behave least ideally?
Phase diagram for SO2 showing solid, liquid, gas, and critical points with marked points A, B, C, D.

검증된 단계별 안내
1
Identify the three red points on the phase diagram: A, B, and C.
Recall that gases behave least ideally at high pressures and low temperatures.
Examine the phase diagram to determine the pressure and temperature at each of the three points.
Compare the pressures and temperatures at points A, B, and C to determine which point has the highest pressure and/or lowest temperature.
Conclude that the point with the highest pressure and/or lowest temperature is where SO2(g) behaves least ideally.

비슷한 문제에 대한 검증된 영상 답변:

이 영상 해법은 위 문제에 도움이 된다고 튜터들이 추천한 것입니다.
영상 길이:
1m
도움이 되었나요?

주요 개념

질문에 올바르게 답하기 위해 반드시 이해해야 하는 핵심 개념들은 다음과 같습니다.

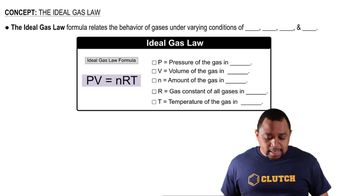
Ideal Gas Behavior

Ideal gas behavior refers to the theoretical behavior of gases that follow the ideal gas law (PV=nRT) perfectly, where pressure (P), volume (V), temperature (T), and the number of moles (n) are related. Real gases deviate from this behavior under high pressure and low temperature, where intermolecular forces and molecular volume become significant. Understanding these deviations is crucial for determining conditions under which a gas behaves least ideally.
추천 영상:
가이드 코스
01:15
Ideal Gas Law Formula

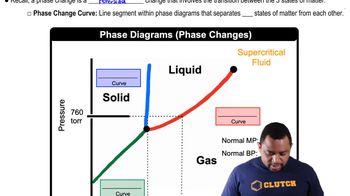
Phase Diagrams

A phase diagram is a graphical representation that shows the phases of a substance (solid, liquid, gas) as a function of temperature and pressure. It includes critical points, triple points, and phase boundaries, which indicate the conditions under which different phases coexist. Analyzing phase diagrams helps predict the state of a substance under varying conditions and is essential for understanding the behavior of SO2 in the given question.
추천 영상:
가이드 코스
03:22
Phase Changes in Diagrams

Critical Point

The critical point on a phase diagram marks the end of the liquid-gas phase boundary, beyond which the distinction between liquid and gas phases disappears, resulting in a supercritical fluid. At this point, properties of the substance change dramatically, and it can exhibit behaviors of both phases. Understanding the critical point is vital for identifying conditions where SO2 behaves least ideally, as gases near this point often show significant deviations from ideal behavior.
추천 영상:
가이드 코스
03:05
Boiling Point Elevation