
Ch.14 - Chemical Kinetics
14์žฅ, ๋ฌธ์ œ 10b

The accompanying graph shows plots of ln k versus 1/๐‘‡ for two different reactions. The plots have been extrapolated to the y-intercepts. Which reaction (red or blue) has b. the larger value for the frequency factor, A? [Section 14.4]

๊ฒ€์ฆ๋œ ๋‹จ๊ณ„๋ณ„ ์•ˆ๋‚ด
1
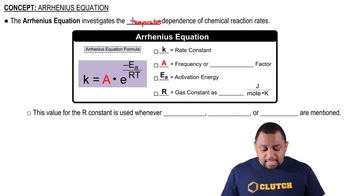
Identify the Arrhenius equation: \( k = A e^{-\frac{E_a}{RT}} \), where \( k \) is the rate constant, \( A \) is the frequency factor, \( E_a \) is the activation energy, \( R \) is the gas constant, and \( T \) is the temperature.
Take the natural logarithm of both sides of the Arrhenius equation to obtain: \( \ln k = \ln A - \frac{E_a}{R} \cdot \frac{1}{T} \).
Recognize that the equation \( \ln k = \ln A - \frac{E_a}{R} \cdot \frac{1}{T} \) is in the form of a straight line \( y = mx + c \), where \( y = \ln k \), \( x = \frac{1}{T} \), \( m = -\frac{E_a}{R} \), and \( c = \ln A \).
Understand that the y-intercept of the plot of \( \ln k \) versus \( \frac{1}{T} \) corresponds to \( \ln A \).
Compare the y-intercepts of the red and blue plots to determine which has the larger \( \ln A \), indicating the larger frequency factor \( A \).

๋น„์Šทํ•œ ๋ฌธ์ œ์— ๋Œ€ํ•œ ๊ฒ€์ฆ๋œ ์˜์ƒ ๋‹ต๋ณ€:

์ด ์˜์ƒ ํ•ด๋ฒ•์€ ์œ„ ๋ฌธ์ œ์— ๋„์›€์ด ๋œ๋‹ค๊ณ  ํŠœํ„ฐ๋“ค์ด ์ถ”์ฒœํ•œ ๊ฒƒ์ž…๋‹ˆ๋‹ค.
์˜์ƒ ๊ธธ์ด:
1m

์ฃผ์š” ๊ฐœ๋…

์งˆ๋ฌธ์— ์˜ฌ๋ฐ”๋ฅด๊ฒŒ ๋‹ตํ•˜๊ธฐ ์œ„ํ•ด ๋ฐ˜๋“œ์‹œ ์ดํ•ดํ•ด์•ผ ํ•˜๋Š” ํ•ต์‹ฌ ๊ฐœ๋…๋“ค์€ ๋‹ค์Œ๊ณผ ๊ฐ™์Šต๋‹ˆ๋‹ค.

Arrhenius Equation

The Arrhenius equation relates the rate constant (k) of a reaction to the temperature (T) and the frequency factor (A). It is expressed as k = A * e^(-Ea/RT), where Ea is the activation energy and R is the gas constant. This equation shows that as temperature increases, the rate constant typically increases, indicating a higher reaction rate.
์ถ”์ฒœ ์˜์ƒ:

Frequency Factor (A)

The frequency factor, A, in the Arrhenius equation represents the number of times that reactants approach the activation barrier per unit time. A larger value of A indicates a higher probability of successful collisions between reactant molecules, which generally leads to a faster reaction rate. It is influenced by factors such as molecular orientation and collision frequency.
์ถ”์ฒœ ์˜์ƒ:
๊ฐ€์ด๋“œ ์ฝ”์Šค
00:31
Frequency-Wavelength Relationship

Graph Interpretation of ln(k) vs. 1/T

In a plot of ln(k) versus 1/T, the slope of the line is related to the negative activation energy (-Ea/R), while the y-intercept corresponds to ln(A). By comparing the y-intercepts of the two plots, one can determine which reaction has a larger frequency factor, A. A higher y-intercept indicates a larger value of A, suggesting a faster reaction rate at a given temperature.
์ถ”์ฒœ ์˜์ƒ:
๊ฐ€์ด๋“œ ์ฝ”์Šค
02:33
Magnitude of Equilibrium Constant