Ch.11 - Liquids, Solids & Intermolecular Forces
Tro - Chemistry: A Molecular Approach 4th Edition
Tro4th EditionChemistry: A Molecular ApproachISBN: 9780134112831당신이 사용하는 게 아니라요?교과서 변경
11장, 문제 87

Examine the phase diagram for iodine shown in Figure 11.39(a). What state transitions occur as we uniformly increase the pressure on a gaseous sample of iodine from 0.010 atm at 185 °C to 100 atm at 185 °C?

검증된 단계별 안내
1
Identify the initial state of iodine at 0.010 atm and 185 °C on the phase diagram. This is likely in the gaseous region.
Determine the path of pressure increase on the phase diagram from 0.010 atm to 100 atm while keeping the temperature constant at 185 °C.
Observe the phase boundaries that the path crosses as pressure increases. Note the transitions from gas to any other phases.
Identify the first phase transition as the pressure increases. This is likely from gas to solid, as iodine sublimates under certain conditions.
Continue to increase the pressure and note any further phase transitions, such as from solid to another phase, if applicable.

주요 개념

질문에 올바르게 답하기 위해 반드시 이해해야 하는 핵심 개념들은 다음과 같습니다.

Phase Diagram

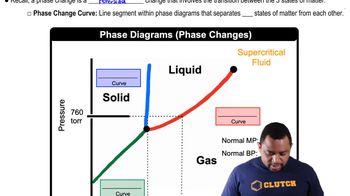
A phase diagram is a graphical representation that shows the states of a substance (solid, liquid, gas) at various temperatures and pressures. It illustrates the boundaries between different phases and indicates the conditions under which each phase is stable. Understanding phase diagrams is crucial for predicting how a substance will behave under changing temperature and pressure conditions.
추천 영상:
가이드 코스
03:22
Phase Changes in Diagrams

State Transitions

State transitions refer to the changes between different phases of matter, such as melting, freezing, vaporization, and condensation. These transitions occur at specific temperatures and pressures, which can be identified on a phase diagram. For iodine, increasing pressure at a constant temperature can lead to transitions from gas to liquid or solid, depending on the pressure applied.
추천 영상:
가이드 코스
03:12
Transition Metals

Critical Point

The critical point on a phase diagram marks the end of the liquid-gas boundary, beyond which the distinction between liquid and gas phases disappears. At this point, the substance exhibits properties of both phases, known as a supercritical fluid. Understanding the critical point is essential for predicting the behavior of iodine under high pressure, as it influences the state transitions that occur.
추천 영상:
가이드 코스
03:05
Boiling Point Elevation