Ch.14 - Chemical Kinetics
Tro - Chemistry: A Molecular Approach 4th Edition
Tro4th EditionChemistry: A Molecular ApproachISBN: 9780134112831당신이 사용하는 게 아니라요?교과서 변경
14장, 문제 36b

This graph shows a plot of the rate of a reaction versus the concentration of the reactant.
b. Make a rough sketch of a plot of [A] versus time

검증된 단계별 안내
1
Understand the relationship between rate and concentration: The rate of a reaction is often dependent on the concentration of the reactants. This relationship can be expressed through a rate law, which is an equation that relates the rate of a reaction to the concentration of the reactants.
Identify the order of the reaction: The shape of the rate versus concentration graph can help determine the order of the reaction. For example, if the graph is linear, the reaction is likely first-order with respect to the reactant. If the graph is a curve, it might be second-order or zero-order.
Sketch the [A] versus time graph: Based on the order of the reaction, sketch the concentration of reactant [A] over time. For a zero-order reaction, [A] decreases linearly over time. For a first-order reaction, [A] decreases exponentially. For a second-order reaction, [A] decreases more steeply at first and then levels off.
Label the axes: On your sketch, label the y-axis as [A], representing the concentration of the reactant, and the x-axis as time.
Indicate the initial concentration: Mark the initial concentration of [A] at time zero on the y-axis. This will help in visualizing how the concentration changes over time.

비슷한 문제에 대한 검증된 영상 답변:

이 영상 해법은 위 문제에 도움이 된다고 튜터들이 추천한 것입니다.
영상 길이:
5m

주요 개념

질문에 올바르게 답하기 위해 반드시 이해해야 하는 핵심 개념들은 다음과 같습니다.

Reaction Rate

The reaction rate is a measure of how quickly reactants are converted into products in a chemical reaction. It is typically expressed as the change in concentration of a reactant or product per unit time. Understanding the factors that influence reaction rates, such as concentration, temperature, and catalysts, is essential for analyzing reaction kinetics.
추천 영상:
가이드 코스
02:03
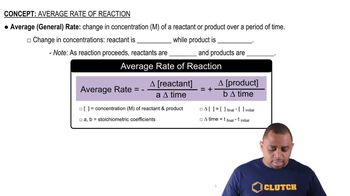
Average Rate of Reaction

Concentration vs. Time Graphs

A concentration versus time graph illustrates how the concentration of a reactant or product changes over the course of a reaction. The shape of this graph can provide insights into the reaction order and kinetics. For example, a linear decrease in concentration suggests a zero-order reaction, while a curved graph may indicate first or second-order kinetics.
추천 영상:
가이드 코스
03:12
Precipitation: Ksp vs Q Example

Integrated Rate Laws

Integrated rate laws relate the concentration of reactants or products to time, allowing for the prediction of concentration changes over the course of a reaction. These laws vary depending on the order of the reaction (zero, first, or second order) and are crucial for sketching concentration versus time plots accurately. Understanding these laws helps in interpreting experimental data and predicting reaction behavior.
추천 영상:
가이드 코스
01:52
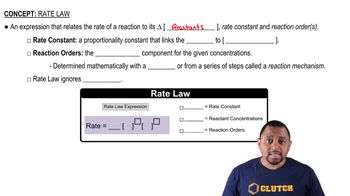
Rate Law Fundamentals