
Ch.17 - Aqueous Ionic Equilibrium
Tro - Chemistry: A Molecular Approach 4th Edition
Tro4th EditionChemistry: A Molecular ApproachISBN: 9780134112831당신이 사용하는 게 아니라요?교과서 변경
17장, 문제 63d

Two 20.0-mL samples, one 0.200 M KOH and the other 0.200 M CH3NH2, are titrated with 0.100 M HI. d. Sketch each titration curve.

검증된 단계별 안내
1
Step 1: Understand the problem. We are asked to sketch the titration curves for two different reactions. A titration curve is a graphical representation of the pH of a solution as a function of the volume of added titrant. In this case, the titrant is HI, a strong acid. The two solutions being titrated are KOH, a strong base, and CH3NH2, a weak base.
Step 2: Sketch the titration curve for KOH and HI. At the start of the titration, the pH is high because KOH is a strong base. As HI is added, the pH decreases. When the amount of HI added is equal to the amount of KOH in the solution (the equivalence point), the pH is 7 because the reaction between a strong acid and a strong base produces a neutral solution. After the equivalence point, the pH continues to decrease as more HI is added.
Step 3: Sketch the titration curve for CH3NH2 and HI. At the start of the titration, the pH is lower than in the KOH case because CH3NH2 is a weak base. As HI is added, the pH decreases. The decrease is gradual at first, then becomes more rapid near the equivalence point, and then slows again after the equivalence point. The pH at the equivalence point is less than 7 because the reaction between a strong acid and a weak base produces an acidic solution.
Step 4: Note the differences between the two curves. The curve for the strong base starts at a higher pH and reaches a pH of 7 at the equivalence point. The curve for the weak base starts at a lower pH and does not reach a pH of 7 at the equivalence point.
Step 5: Remember that the exact shape of the curve can depend on the specific concentrations and volumes of the solutions, as well as the specific acid and base involved. However, the general trends described above will hold true for any titration of a strong acid with a strong base or a weak base.

비슷한 문제에 대한 검증된 영상 답변:

이 영상 해법은 위 문제에 도움이 된다고 튜터들이 추천한 것입니다.
영상 길이:
11m
도움이 되었나요?

주요 개념

질문에 올바르게 답하기 위해 반드시 이해해야 하는 핵심 개념들은 다음과 같습니다.

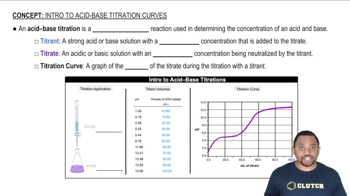
Titration

Titration is a quantitative analytical technique used to determine the concentration of a solute in a solution. It involves the gradual addition of a titrant (a solution of known concentration) to a sample until the reaction reaches its endpoint, which is often indicated by a color change or a pH change. Understanding the titration process is essential for sketching titration curves, as it illustrates how the pH of the solution changes as the titrant is added.
추천 영상:
가이드 코스
03:04
Acid-Base Titration

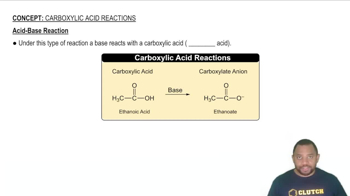
Acid-Base Reactions

Acid-base reactions involve the transfer of protons (H+) between reactants. In this case, KOH is a strong base and CH3NH2 is a weak base, while HI is a strong acid. The nature of the acid and base involved affects the shape of the titration curve, particularly the pH at the equivalence point and the steepness of the curve. Recognizing the differences between strong and weak acids and bases is crucial for accurately sketching the titration curves.
추천 영상:
가이드 코스
01:09
Acid-Base Reaction

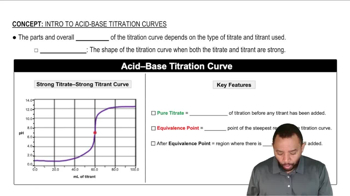
Titration Curves

Titration curves graphically represent the change in pH of a solution as a titrant is added. The shape of the curve depends on the strength of the acid and base involved. For strong acid-strong base titrations, the curve typically shows a sharp increase in pH at the equivalence point, while weak acid-strong base titrations exhibit a more gradual slope. Understanding these characteristics is vital for sketching the correct titration curves for the given samples.
추천 영상:
가이드 코스
02:16
Acid-Base Titration Curves