

Ch.18 - Aqueous Ionic Equilibrium
Tro - Chemistry: A Molecular Approach 5th Edition
Tro5th EditionChemistry: A Molecular ApproachISBN: 9780134874371당신이 사용하는 게 아니라요?교과서 변경
18장, 문제 64b

The graphs labeled (a) and (b) show the titration curves for two equal-volume samples of bases, one weak and one strong. Both titrations were carried out with the same concentration of strong acid.
(ii) Which graph corresponds to the titration of the strong base and which one to the weak base?

검증된 단계별 안내
1
Identify the key features of a titration curve for a strong base: A strong base will have a higher initial pH and a more pronounced, steep drop at the equivalence point.
Identify the key features of a titration curve for a weak base: A weak base will have a lower initial pH and a more gradual slope at the equivalence point.
Compare the initial pH values of the two graphs: The graph with the higher initial pH likely corresponds to the strong base.
Examine the steepness of the drop at the equivalence point: The graph with the steeper drop is indicative of the strong base.
Determine which graph has a more gradual slope and lower initial pH: This graph corresponds to the weak base.

비슷한 문제에 대한 검증된 영상 답변:

이 영상 해법은 위 문제에 도움이 된다고 튜터들이 추천한 것입니다.
영상 길이:
1m
도움이 되었나요?

주요 개념

질문에 올바르게 답하기 위해 반드시 이해해야 하는 핵심 개념들은 다음과 같습니다.

Titration Curves

Titration curves graphically represent the pH change of a solution as a titrant is added. The shape of the curve is influenced by the strength of the acid and base involved. Strong acids and bases typically show a steep rise in pH near the equivalence point, while weak acids and bases exhibit a more gradual change due to their incomplete dissociation.
추천 영상:
가이드 코스
02:16
Acid-Base Titration Curves

Strong vs. Weak Bases

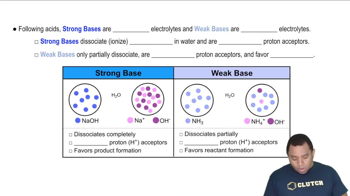
Strong bases, such as sodium hydroxide, completely dissociate in solution, leading to a rapid increase in pH when titrated with a strong acid. In contrast, weak bases, like ammonia, only partially dissociate, resulting in a slower pH change. This fundamental difference affects the shape and steepness of the titration curve.
추천 영상:
가이드 코스
02:22
Strong vs Weak Bases

Equivalence Point

The equivalence point in a titration is reached when the amount of titrant added is stoichiometrically equivalent to the amount of substance in the solution being titrated. At this point, the pH of the solution can vary significantly depending on whether a strong or weak base is involved, influencing the overall shape of the titration curve.
추천 영상:
가이드 코스
01:07
At the Equivalence Point