Ch.6 - Gases
Tro - Chemistry: A Molecular Approach 5th Edition
Tro5th EditionChemistry: A Molecular ApproachISBN: 9780134874371당신이 사용하는 게 아니라요?교과서 변경
6장, 문제 90

The graph shows the distribution of molecular velocities for the same molecule at two different temperatures (T1 and T2). Which temperature is greater? Explain.
Graph showing molecular velocity distributions at two temperatures, T1 (blue) and T2 (red).

검증된 단계별 안내
1
Observe the graph showing the distribution of molecular velocities for the same molecule at two different temperatures, T1 (blue) and T2 (red).
Note that the x-axis represents molecular velocity (m/s) and the y-axis represents the relative number of molecules.
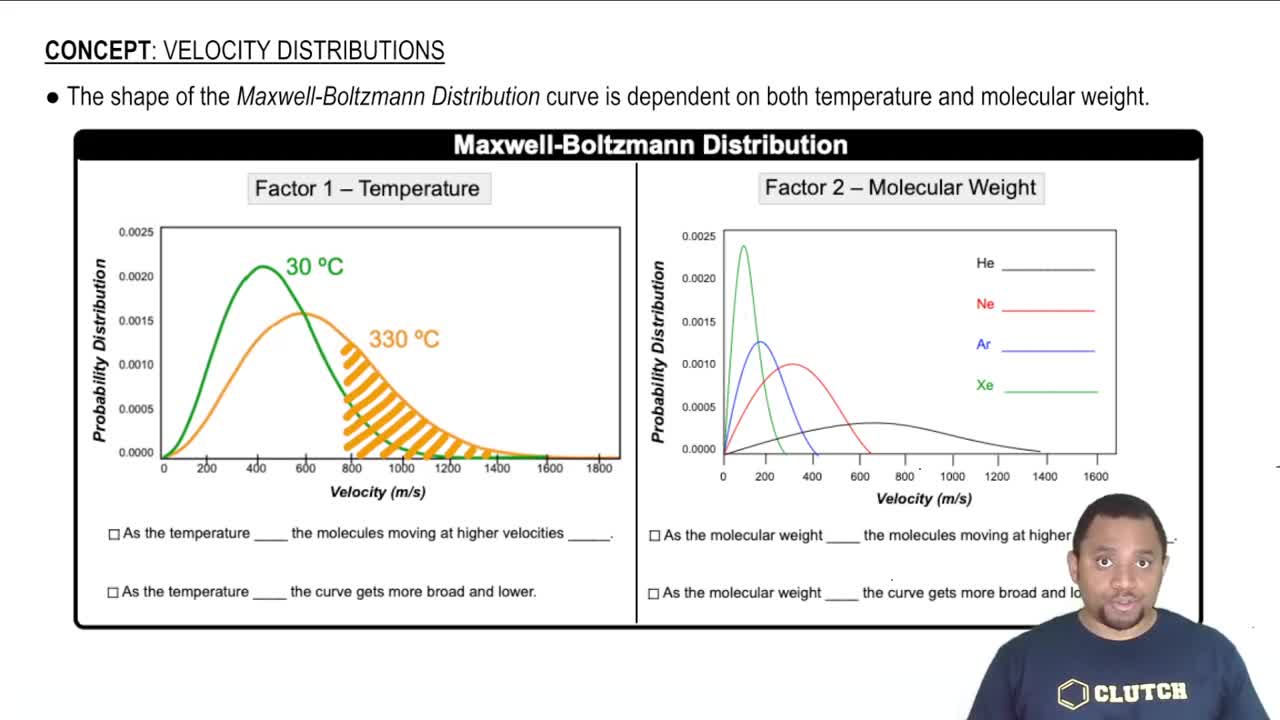
Understand that at higher temperatures, the distribution of molecular velocities broadens and shifts to higher velocities.
Compare the two curves: the red curve (T2) is broader and shifted to higher velocities compared to the blue curve (T1).
Conclude that T2 is the higher temperature because the distribution of molecular velocities is broader and shifted to higher velocities compared to T1.

비슷한 문제에 대한 검증된 영상 답변:

이 영상 해법은 위 문제에 도움이 된다고 튜터들이 추천한 것입니다.
영상 길이:
3m
도움이 되었나요?

주요 개념

질문에 올바르게 답하기 위해 반드시 이해해야 하는 핵심 개념들은 다음과 같습니다.

Kinetic Molecular Theory

The Kinetic Molecular Theory explains the behavior of gases in terms of particles in constant motion. It posits that the temperature of a gas is directly related to the average kinetic energy of its molecules. As temperature increases, the average velocity of the molecules also increases, leading to a broader distribution of molecular speeds.
추천 영상:
가이드 코스
01:19
Kinetic Molecular Theory

Maxwell-Boltzmann Distribution

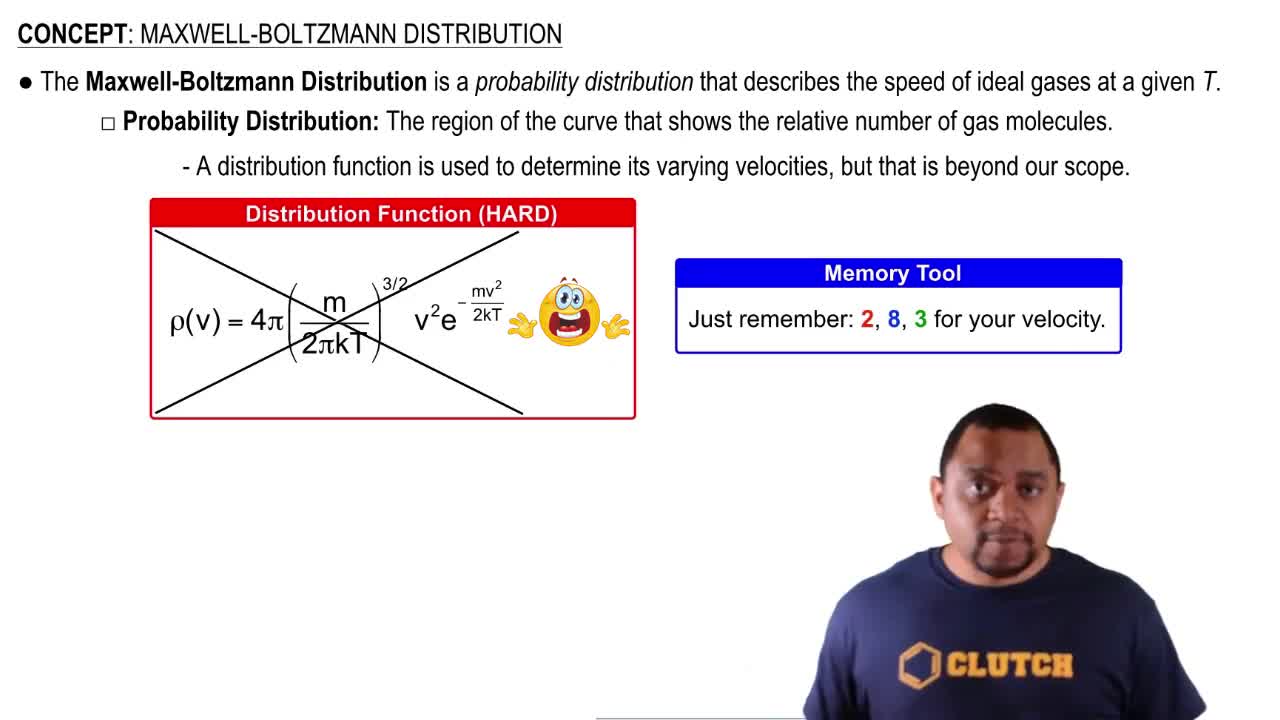
The Maxwell-Boltzmann distribution describes the distribution of speeds among molecules in a gas. It shows that at higher temperatures, the distribution curve shifts to higher velocities, indicating that more molecules have higher kinetic energy. The peak of the curve represents the most probable speed of the molecules, which shifts to the right as temperature increases.
추천 영상:
가이드 코스
00:54
Maxwell-Boltzmann Distribution

Temperature and Molecular Velocity

Temperature is a measure of the average kinetic energy of the molecules in a substance. In the context of the graph, the temperature associated with the red curve (T2) is greater than that of the blue curve (T1), as indicated by the broader distribution and higher average molecular velocities at T2. This relationship is crucial for understanding how temperature affects molecular motion.
추천 영상:
가이드 코스
02:47
Velocity Distributions