Ch.1 Chemistry in Our Lives
Timberlake - Chemistry: An Introduction to General, Organic, and Biological Chemistry 14th Edition
Timberlake14th EditionChemistry: An Introduction to General, Organic, and Biological ChemistryISBN: 9781292472249당신이 사용하는 게 아니라요?교과서 변경
1장, 문제 22d

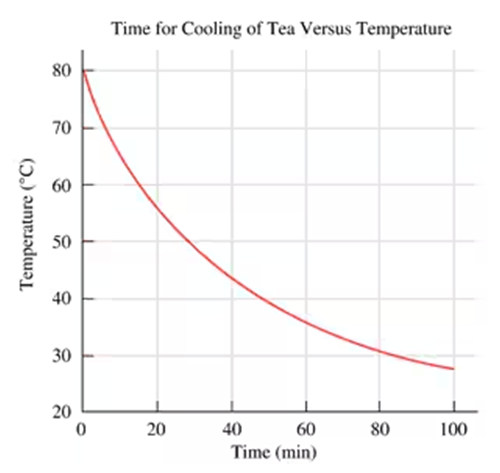
Use the following graph for problems 1.23 and 1.24:

How many minutes were needed to reach a temperature of 45 °C?

검증된 단계별 안내
1
Step 1: Observe the graph titled 'Temperature of a Liquid vs Heating Time'. The x-axis represents time in minutes, and the y-axis represents temperature in degrees Celsius (°C).
Step 2: Locate the temperature of 45 °C on the y-axis. This is the target temperature we are trying to find the corresponding time for.
Step 3: Draw a horizontal line from the 45 °C mark on the y-axis until it intersects the curve representing the temperature change over time.
Step 4: From the point of intersection, draw a vertical line down to the x-axis to determine the corresponding time in minutes.
Step 5: Read the value on the x-axis where the vertical line meets it. This value represents the number of minutes needed to reach a temperature of 45 °C.

비슷한 문제에 대한 검증된 영상 답변:

이 영상 해법은 위 문제에 도움이 된다고 튜터들이 추천한 것입니다.
영상 길이:
59s
도움이 되었나요?

주요 개념

질문에 올바르게 답하기 위해 반드시 이해해야 하는 핵심 개념들은 다음과 같습니다.

Graph Interpretation

Graph interpretation involves analyzing visual data representations to extract meaningful information. In this context, understanding how to read the axes, identify trends, and determine specific values, such as the time it takes to reach a certain temperature, is crucial for answering the question.
추천 영상:
가이드 코스
00:35
The Scientific Method Example 2

Temperature vs. Time Relationship

The relationship between temperature and time in this graph illustrates how a liquid's temperature increases as it is heated over time. Recognizing this relationship helps in predicting the time required to reach specific temperatures, such as 45 °C, by observing the curve's progression.
추천 영상:
가이드 코스
04:56
Logarithmic Relationships

Data Extraction

Data extraction refers to the process of obtaining specific values from a graph. In this case, it involves locating the point where the temperature reaches 45 °C on the graph and tracing it horizontally to find the corresponding time in minutes, which is essential for accurately answering the question.
추천 영상: