Look again at the trends illustrated in Figures 2.3 and 2.4.
a. How do the peaks/valleys correlate with locations in the periodic table?
b. Are there other chemical properties that also exhibit periodic trends? What are they?
검증된 단계별 안내
1
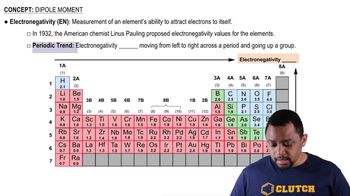
Examine the graph to identify the periodic trend of electronegativity across the periodic table, noting the peaks and valleys.
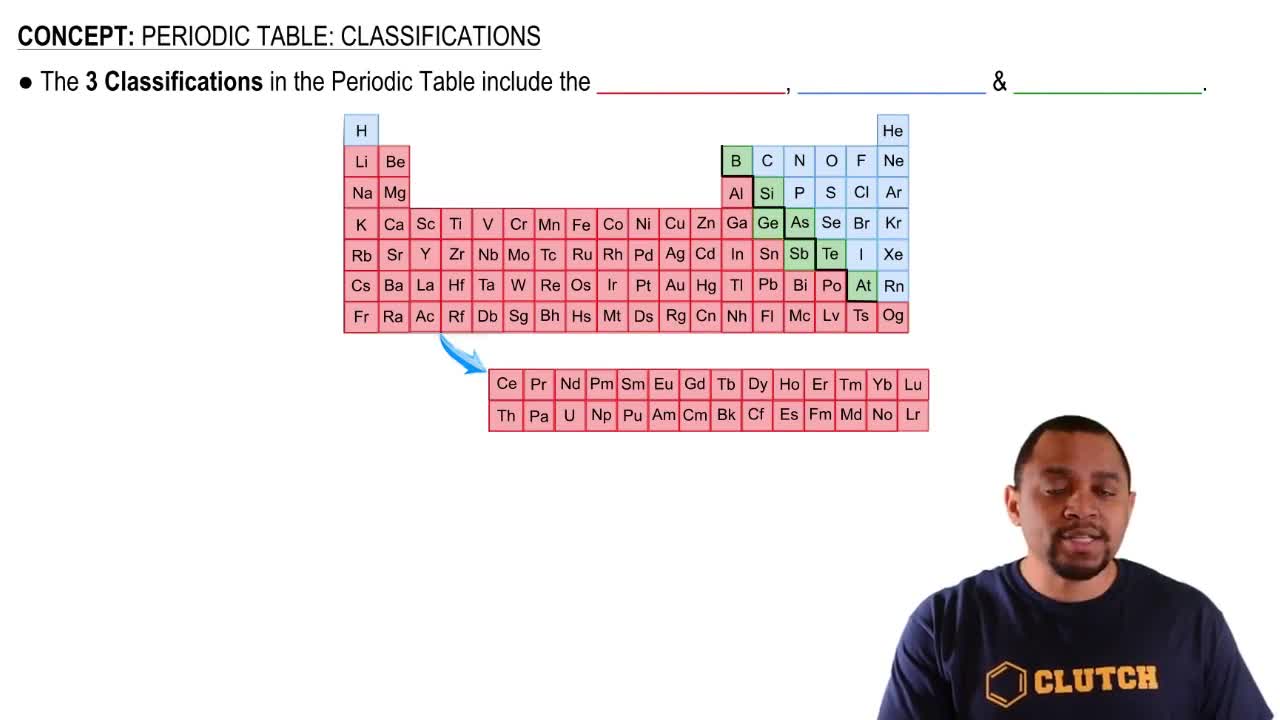
Correlate the peaks in electronegativity with the positions of nonmetals, particularly halogens, in the periodic table.
Correlate the valleys in electronegativity with the positions of metals, particularly alkali metals, in the periodic table.
Identify other chemical properties that exhibit periodic trends, such as atomic radius, ionization energy, and electron affinity.
Discuss how these properties, like electronegativity, vary across periods and down groups in the periodic table.
비슷한 문제에 대한 검증된 영상 답변:
이 영상 해법은 위 문제에 도움이 된다고 튜터들이 추천한 것입니다.
영상 길이:
6m
영상 재생:
0 댓글
주요 개념
질문에 올바르게 답하기 위해 반드시 이해해야 하는 핵심 개념들은 다음과 같습니다.
Periodic Trends
Periodic trends refer to the predictable patterns observed in the properties of elements as you move across or down the periodic table. These trends include variations in atomic radius, ionization energy, electronegativity, and electron affinity. Understanding these trends helps in predicting the behavior of elements in chemical reactions and their interactions with other elements.
Electronegativity is a measure of an atom's ability to attract and hold onto electrons when forming chemical bonds. It varies across the periodic table, generally increasing from left to right and decreasing from top to bottom. This property is crucial for understanding bond formation and the polarity of molecules, influencing reactivity and compound stability.
The correlation between peaks and valleys in trends like electronegativity and their locations in the periodic table reflects the underlying electronic structure of the elements. Elements in the same group often exhibit similar properties due to their valence electron configurations, while elements in the same period show variations based on increasing nuclear charge. This relationship is key to predicting chemical behavior and properties.

 6:16분
6:16분
 검증된 단계별 안내
 00:38
00:38