Skip to main content
Macroeconomics
나의 코스
배우기
시험 준비
AI 튜터
학습 가이드
플래시카드
탐험해 보세요
앱을 사용해 보세요
나의 코스
배우기
시험 준비
AI 튜터
학습 가이드
플래시카드
탐험해 보세요
앱을 사용해 보세요
뒤로
Dynamic AD-AS Model: Inflation and Recession quiz
카드를 뒤집기 위해 탭할 수 있습니다.
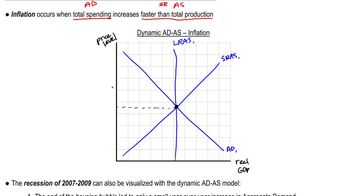
What causes inflation in the dynamic AD-AS model?
카드를 뒤집기 위해 탭할 수 있습니다.
👆
What causes inflation in the dynamic AD-AS model?
Inflation occurs when aggregate demand increases faster than aggregate supply, leading to rising prices as demand outstrips supply.
진행 상황 추적
컨트롤 버튼이 '내비게이션' 모드로 변경되었습니다.
1/15
관련 플래시카드
관련 실천
추천 영상
Dynamic AD-AS Model: Inflation and Recession definitions
Dynamic AD-AS Model: Inflation and Recession
15 용어
Dynamic AD-AS Model: Inflation and Recession
23. Dynamic AD/AS Model
10 문제점
주제
Dynamic AD-AS Model: Fiscal Policy
23. Dynamic AD/AS Model
10 문제점
주제
25. Dynamic AD/AS Model
4 주제
15 문제점
장
VideoThumbView.guidedCourse
06:30
Dynamic AD-AS Model: Recession
1086
views
13
rank
VideoThumbView.guidedCourse
04:05
Dynamic AD-AS Model: Inflation
1244
views
11
rank
이 집합의 용어 (15)
하이드의 정의
What causes inflation in the dynamic AD-AS model?
Inflation occurs when aggregate demand increases faster than aggregate supply, leading to rising prices as demand outstrips supply.
How does the aggregate demand curve shift during inflation in the dynamic AD-AS model?
The aggregate demand curve shifts significantly to the right, more than the short-run aggregate supply curve.
What happens to the price level and GDP when aggregate demand shifts more than short-run aggregate supply?
The price level increases and GDP also rises, resulting in inflation.
In the dynamic AD-AS model, what is the main factor leading to higher price levels during inflation?
A larger rightward shift in aggregate demand compared to the short-run aggregate supply causes higher price levels.
What is the effect of a small shift in short-run aggregate supply compared to a large shift in aggregate demand?
It results in inflation, with both higher prices and increased GDP.
What are the axes on the dynamic AD-AS model graph?
The y-axis represents the price level, and the x-axis represents real GDP.
What three curves are used in the dynamic AD-AS model?
The model uses the aggregate demand curve, short-run aggregate supply curve, and long-run aggregate supply curve.
What major event contributed to the 2007-2009 recession in the dynamic AD-AS model?
The end of the housing bubble, which led to a small increase in aggregate demand.
How did the financial crisis during the 2007-2009 recession affect aggregate demand?
It limited credit availability, causing aggregate demand to shift only slightly to the right.
What supply shock occurred during the 2007-2009 recession, and how did it affect the model?
Rising oil prices caused a large leftward shift in short-run aggregate supply.
How does a supply shock affect short-run and long-run aggregate supply in the dynamic AD-AS model?
A supply shock affects only the short-run aggregate supply, not the long-run aggregate supply.
What happens to equilibrium in the dynamic AD-AS model during a recession?
The new equilibrium shows higher prices and lower GDP compared to the previous year.
How is the 2007-2009 recession represented graphically in the dynamic AD-AS model?
Aggregate demand shifts slightly right, while short-run aggregate supply shifts significantly left, resulting in higher prices and lower GDP.
Why does long-run aggregate supply continue to increase even during a recession?
Long-run aggregate supply increases due to factors like technology and labor force growth, reflecting rising potential GDP.
Where is the short-run equilibrium found in the dynamic AD-AS model during a recession?
It is at the intersection of the new aggregate demand and short-run aggregate supply curves, showing the effects of the recession.
 뒤로뒤로
뒤로뒤로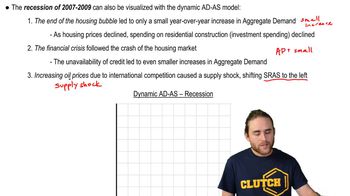
 06:30
06:30