Skip to main content
Macroeconomics
나의 코스
배우기
시험 준비
AI 튜터
학습 가이드
플래시카드
탐험해 보세요
앱을 사용해 보세요
나의 코스
배우기
시험 준비
AI 튜터
학습 가이드
플래시카드
탐험해 보세요
앱을 사용해 보세요
뒤로
Graphing Review definitions
카드를 뒤집기 위해 탭할 수 있습니다.
Axes
카드를 뒤집기 위해 탭할 수 있습니다.
👆
Axes
The two perpendicular lines on a graph, typically labeled as price (vertical) and quantity (horizontal) in economics.
진행 상황 추적
컨트롤 버튼이 '내비게이션' 모드로 변경되었습니다.
1/17
관련 플래시카드
관련 실천
추천 영상
Graphing Review quiz
Graphing Review
15 용어
Graphing Review
1. Introduction to Macroeconomics
5 문제점
주제
Percentage and Decimal Review
1. Introduction to Macroeconomics
10 문제점
주제
1. Introduction to Macroeconomics - Part 1 of 2
8 주제
14 문제점
장
1. Introduction to Macroeconomics - Part 2 of 2
1 주제
3 문제점
장
VideoThumbView.guidedCourse
03:40
Calculating Slope of a Curve: Point Method
3706
views
63
rank
VideoThumbView.guidedCourse
03:27
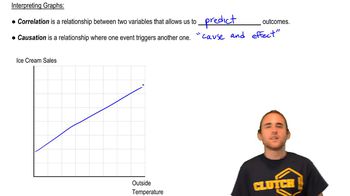
Interpreting Graphs (Part One)
3602
views
50
rank
VideoThumbView.guidedCourse
02:32
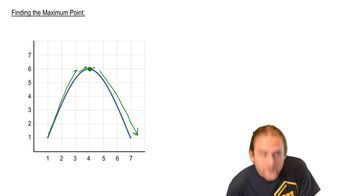
Finding Maximum and Minimum on a Graph
3191
views
41
rank
이 집합의 용어 (17)
하이드의 정의
Axes
The two perpendicular lines on a graph, typically labeled as price (vertical) and quantity (horizontal) in economics.
Demand Schedule
A table showing various prices and the corresponding quantities demanded, used to plot points on a graph.
Curve
A line connecting plotted points on a graph, which can be straight or bent, representing relationships between variables.
Intersection
The point where two lines or curves cross on a graph, often indicating equilibrium or a key outcome.
Slope
A measure of how much the vertical value changes for each unit change in the horizontal value, indicating steepness.
Rise
The change in the vertical value between two points on a graph, used in calculating slope.
Run
The change in the horizontal value between two points on a graph, paired with rise to determine slope.
Tangent Line
A straight line that touches a curve at only one point, used to find the slope at that exact spot.
Arc Method
A technique for finding the average slope between two points on a curve by connecting them with a straight line.
Maximum Point
The highest point on a graph where the direction changes from rising to falling, indicating a peak.
Minimum Point
The lowest point on a graph where the direction changes from falling to rising, indicating a trough.
Area of Triangle
A region on a graph calculated as half the product of its base and height, often used to measure surplus or loss.
Area of Rectangle
A region on a graph found by multiplying base and height, useful for calculating total values like revenue.
Correlation
A relationship between two variables where changes in one help predict changes in the other, without implying cause.
Causation
A direct link where one event produces another, establishing a cause-and-effect relationship between variables.
Omitted Variable Bias
A problem in graph interpretation when a relevant factor is left out, leading to misleading conclusions.
Reverse Causality
A misinterpretation where the direction of cause and effect is mistakenly flipped between two variables.
 뒤로뒤로
뒤로뒤로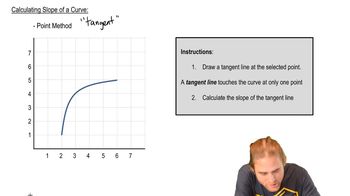
 03:40
03:40