Skip to main content
Macroeconomics
나의 코스
배우기
시험 준비
AI 튜터
학습 가이드
플래시카드
탐험해 보세요
앱을 사용해 보세요
나의 코스
배우기
시험 준비
AI 튜터
학습 가이드
플래시카드
탐험해 보세요
앱을 사용해 보세요
뒤로
Perfect Competition Profit on the Graph quiz
카드를 뒤집기 위해 탭할 수 있습니다.
Where does a perfectly competitive firm maximize profit on a graph?
카드를 뒤집기 위해 탭할 수 있습니다.
👆
Where does a perfectly competitive firm maximize profit on a graph?
A perfectly competitive firm maximizes profit where marginal revenue equals marginal cost.
진행 상황 추적
컨트롤 버튼이 '내비게이션' 모드로 변경되었습니다.
1/15
관련 플래시카드
추천 영상
Perfect Competition Profit on the Graph definitions
Perfect Competition Profit on the Graph
15 용어
VideoThumbView.guidedCourse
13:25
Profit on the Graph in Perfect Competition
3
views
이 집합의 용어 (15)
하이드의 정의
Where does a perfectly competitive firm maximize profit on a graph?
A perfectly competitive firm maximizes profit where marginal revenue equals marginal cost.
In perfect competition, what is the relationship between price, marginal revenue, and average revenue?
In perfect competition, price equals both marginal revenue and average revenue.
What is the formula for calculating profit for a firm?
Profit is calculated as (Price - Average Total Cost) × Quantity.
What does it mean if price is greater than average total cost at the profit-maximizing quantity?
If price is greater than average total cost, the firm earns a profit.
What happens if price is less than average total cost at the profit-maximizing quantity?
If price is less than average total cost, the firm incurs a loss but still minimizes that loss by producing where MR = MC.
What is the outcome if price equals average total cost at the profit-maximizing quantity?
If price equals average total cost, the firm breaks even, earning zero economic profit.
How do you find the profit-maximizing quantity on a graph?
Find the quantity where the marginal revenue curve intersects the marginal cost curve.
On a graph, how do you determine the price the firm receives for its product in perfect competition?
The price is found on the demand curve at the profit-maximizing quantity.
How do you find the average total cost at the profit-maximizing quantity on a graph?
Locate the average total cost curve at the profit-maximizing quantity.
What does the area between the price and average total cost curves at the profit-maximizing quantity represent?
It represents the profit (if price > ATC) or loss (if price < ATC) per unit, multiplied by the quantity.
If a firm cannot produce a fractional unit at the MR = MC point, what should it do?
The firm should produce the lower whole number quantity to avoid marginal cost exceeding marginal revenue.
Why is the demand curve for a perfectly competitive firm also its marginal revenue curve?
Because the firm is a price taker, each additional unit sold adds the same amount to total revenue, making demand equal to marginal revenue.
What is the significance of the loss-minimizing quantity for a firm?
It is the quantity where the firm loses the least amount of money, which occurs where MR = MC even if price is below ATC.
What are the two main steps to calculate profit or loss on a graph for a perfectly competitive firm?
First, find where MR = MC to determine quantity; second, use price and ATC at that quantity to calculate profit or loss.
What does it mean for a firm to 'break even' in perfect competition?
Breaking even means total revenue equals total cost, so the firm earns zero economic profit.
 뒤로뒤로
뒤로뒤로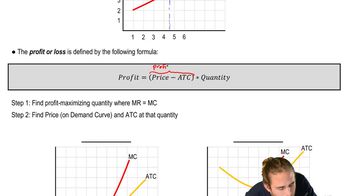
 13:25
13:25