Skip to main content
Macroeconomics
나의 코스
배우기
시험 준비
AI 튜터
학습 가이드
플래시카드
탐험해 보세요
앱을 사용해 보세요
나의 코스
배우기
시험 준비
AI 튜터
학습 가이드
플래시카드
탐험해 보세요
앱을 사용해 보세요
뒤로
Price Elasticity of Supply on a Graph definitions
카드를 뒤집기 위해 탭할 수 있습니다.
Supply Curve
카드를 뒤집기 위해 탭할 수 있습니다.
👆
Supply Curve
Graphical representation showing the relationship between price and quantity supplied, typically sloping upward.
진행 상황 추적
컨트롤 버튼이 '내비게이션' 모드로 변경되었습니다.
1/14
관련 플래시카드
관련 실천
추천 영상
Price Elasticity of Supply on a Graph quiz
Price Elasticity of Supply on a Graph
15 용어
Price Elasticity of Supply on a Graph
4. Elasticity
10 문제점
주제
Elasticity Summary
4. Elasticity
9 문제점
주제
4. Elasticity - Part 1 of 2
10 주제
15 문제점
장
4. Elasticity - Part 2 of 2
1 주제
3 문제점
장
VideoThumbView.guidedCourse
03:46
Price Elasticity of Supply on a Graph
2612
views
34
rank
이 집합의 용어 (14)
하이드의 정의
Supply Curve
Graphical representation showing the relationship between price and quantity supplied, typically sloping upward.
Elasticity
Measure of responsiveness of quantity supplied to changes in price, varying along different supply curves.
Perfectly Elastic Supply
Situation where any price change leads to infinite change in quantity supplied, depicted as a horizontal line.
Perfectly Inelastic Supply
Condition where quantity supplied remains unchanged regardless of price, shown as a vertical line.
Elastic Supply
Case where quantity supplied responds strongly to price changes, with the curve cutting the price axis.
Inelastic Supply
Scenario where quantity supplied responds weakly to price changes, with the curve cutting the quantity axis.
Unit Elastic Supply
Situation where percentage change in quantity supplied equals percentage change in price, with the curve passing through the origin.
Price Axis
Vertical axis on a graph representing different possible prices for a good or service.
Quantity Axis
Horizontal axis on a graph representing different possible quantities supplied.
Origin
Point where the price and quantity axes intersect, indicating zero price and zero quantity.
Upward Slope
Characteristic of supply curves indicating that higher prices are associated with higher quantities supplied.
Horizontal Line
Graphical feature representing perfect elasticity, where supply is infinitely responsive to price.
Vertical Line
Graphical feature representing perfect inelasticity, where supply does not change with price.
Axis Intersection
Location where a supply curve crosses either the price or quantity axis, indicating elasticity type.
 뒤로뒤로
뒤로뒤로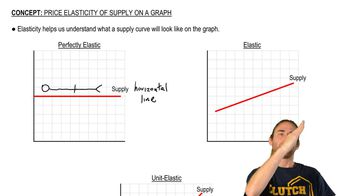
 03:46
03:46