Skip to main content
Macroeconomics
나의 코스
배우기
시험 준비
AI 튜터
학습 가이드
플래시카드
탐험해 보세요
앱을 사용해 보세요
나의 코스
배우기
시험 준비
AI 튜터
학습 가이드
플래시카드
탐험해 보세요
앱을 사용해 보세요
뒤로
Supply and Demand Together: One-sided Shifts quiz
카드를 뒤집기 위해 탭할 수 있습니다.
What is the first step in analyzing a shift in demand or supply?
카드를 뒤집기 위해 탭할 수 있습니다.
👆
What is the first step in analyzing a shift in demand or supply?
The first step is to identify whether the event is causing a demand shift, a supply shift, or both.
진행 상황 추적
컨트롤 버튼이 '내비게이션' 모드로 변경되었습니다.
1/15
관련 플래시카드
관련 실천
추천 영상
Supply and Demand Together: One-sided Shifts definitions
Supply and Demand Together: One-sided Shifts
15 용어
Supply and Demand Together: One-sided Shifts
3. Supply and Demand
10 문제점
주제
Supply and Demand Together: Both Shift
3. Supply and Demand
10 문제점
주제
3. Supply and Demand - Part 1 of 2
11 주제
15 문제점
장
3. Supply and Demand - Part 2 of 2
1 주제
3 문제점
장
VideoThumbView.guidedCourse
04:26
Demand Shifts
457
views
9
rank
VideoThumbView.guidedCourse
03:36
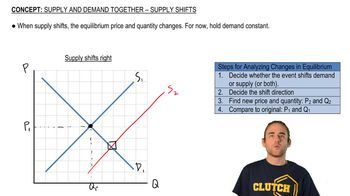
Supply Shifts
3112
views
39
rank
이 집합의 용어 (15)
하이드의 정의
What is the first step in analyzing a shift in demand or supply?
The first step is to identify whether the event is causing a demand shift, a supply shift, or both.
When demand increases, what happens to equilibrium price and quantity?
Both equilibrium price and quantity increase when demand increases.
What direction does the demand curve shift when there is a decrease in demand?
The demand curve shifts to the left when demand decreases.
How does a decrease in demand affect equilibrium price and quantity?
A decrease in demand lowers both the equilibrium price and the equilibrium quantity.
What graphical tool is used to distinguish between original and new equilibrium points?
Circles are used for the original equilibrium and squares for the new equilibrium.
What happens to equilibrium price and quantity when supply increases?
Equilibrium price decreases and equilibrium quantity increases when supply increases.
If input prices rise, causing a supply shift, which direction does the supply curve move?
The supply curve shifts to the left when input prices rise.
What is the effect on equilibrium price and quantity when supply decreases?
A decrease in supply raises the equilibrium price and lowers the equilibrium quantity.
Why is it important to label axes and curves consistently in supply and demand graphs?
Consistent labeling helps clearly identify changes and compare original and new equilibriums.
What is the typical result of a technological advancement in an industry on the supply curve?
Technological advancement shifts the supply curve to the right, increasing supply.
What are the four steps to analyze a shift in demand or supply?
Identify the shift, decide the direction, find the new equilibrium, and compare the changes.
How do you determine if a shift is due to demand or supply?
You analyze the determinants in the scenario to see if they affect consumers (demand) or producers (supply).
What happens to equilibrium price and quantity when demand decreases?
Both equilibrium price and quantity decrease when demand decreases.
How does an increase in the price of a complementary good affect the demand curve?
An increase in the price of a complementary good shifts the demand curve to the left.
What visual method is recommended for showing the direction of a curve shift on a graph?
Draw an arrow from the original curve to the new curve to indicate the direction of the shift.
 뒤로뒤로
뒤로뒤로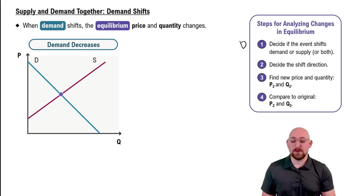
 04:26
04:26